Upsetjs
😠 UpSet.js - a set visualization library for rendering UpSet Plots (a JavaScript re-implementation of UpSet(R) by Lex et al), Euler Diagrams, Venn Diagrams, and Karnaugh Maps
Install / Use
/learn @upsetjs/UpsetjsREADME
UpSet.js
[![NPM Package][npm-image]][npm-url] [![Github Actions][github-actions-image]][github-actions-url]
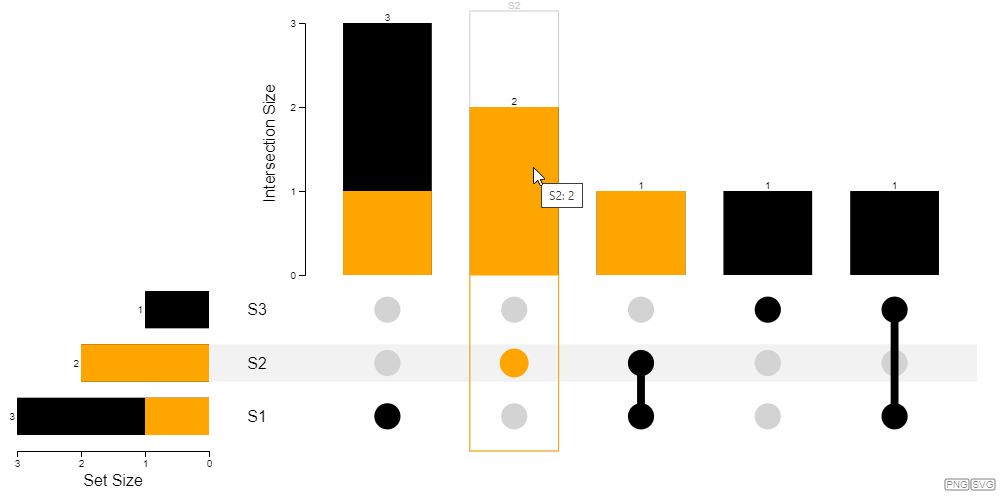
UpSet.js is a JavaScript re-implementation of UpSetR which itself is based on UpSet to create interactive set visualizations for more than three sets. The core library is written in React but provides also bundle editions for plain JavaScript use. The UpSetJS React component is implemented as a pure functional component solely depending on the given properties.

More details about UpSet.js can be found on the Medium article series about it:
- UpSet.js — The UpSet.js Ecosystem
- UpSet.js — JavaScript Tutorial
- UpSet.js — Behind the (technical) Scenes
This monorepo contains following packages:
-
@upsetjs/model the data model definition of UpSet.js ![Open Docs][docs]
-
@upsetjs/react the main UpSet.js React component ![Open Docs][docs]
-
@upsetjs/math utility package for computing stats
-
@upsetjs/addons extensions to the React component for rendering boxplots ![Open Docs][docs]
-
@upsetjs/bundle zero dependency bundle of the react and addons component using Preact ![Open Docs][docs]
-
@upsetjs/plots VEGA plot helper to be linked with UpSet.js ![Open Docs][docs]
-
@upsetjs/app example application to explore datasets using UpSet.js with import and export features ![Open Example][example]
-
@upsetjs/vue vue wrapper based on the bundled version
In addition, there are the following sibling repositories and projects
-
upsetjs_r R HTMLWidget wrapper around UpSet.js [![CRAN][cran-image]][cran-url] [![Open in Binder][binder]][binder-r-url] [![Open Docs][docs]][docs-r-url] [![Open example][example]][example-r-url]
-
upsetjs_jupyter_widget Jupyter Widget wrapper around UpSet.js [![Open in NBViewer][nbviewer]][nbviewer-url] [![Open in Binder][binder]][binder-j-url] [![Open API Docs][docs]][docs-j-url] [![Open Example][example]][example-j-url]
-
upsetjs_powerbi_visuals PowerBI Custom Visuals around UpSet.js
-
upsetjs_tableau_extension Tableau extension around UpSet.js
-
upset-js Observable HQ wrapper around UpSet.js [![Open Example][example]][example-o-url]
Usage and Installation
React
npm install @upsetjs/react react react-dom
import React from 'react';
import UpSetJS, { extractCombinations, ISetLike } from '@upsetjs/react';

const elems = [
  { name: 'A', sets: ['S1', 'S2'] },
  { name: 'B', sets: ['S1'] },
  { name: 'C', sets: ['S2'] },
  { name: 'D', sets: ['S1', 'S3'] },
];

const { sets, combinations } = extractCombinations(elems);

<UpSetJS sets={sets} combinations={combinations} width={500} height={300} />;
with stored selection
const UpSetJSSelection = (props: any) => {
  [selection, setSelection] = React.useState(null as ISetLike<any> | null);

  return <UpSetJS {...props} selection={selection} onHover={setSelection} />;
};

<UpSetJSSelection sets={sets} combinations={combinations} width={500} height={300} />;
Bundled version
npm install @upsetjs/bundle
import { extractCombinations, render } from '@upsetjs/bundle';

const elems = [
  { name: 'A', sets: ['S1', 'S2'] },
  { name: 'B', sets: ['S1'] },
  { name: 'C', sets: ['S2'] },
  { name: 'D', sets: ['S1', 'S3'] },
];

const { sets, combinations } = extractCombinations(elems);

render(document.body, { sets, combinations, width: 500, height: 300 });
with stored selection
let selection = null;

function onHover(set) {
  selection = set;
  rerender();
}

function rerender() {
  const props = { sets, combinations, width: 500, height: 300, selection, onHover };
  render(document.body, props);
}

rerender();
see also ![Open in CodePen][codepen]
Venn Diagrams
For comparison and convenience reasons UpSet.js also has a Venn Diagram component for rendering two or three sets.
import React from 'react';
import { VennDiagram, extractSets, ISetLike } from '@upsetjs/react';

const elems = [
  { name: 'A', sets: ['S1', 'S2'] },
  { name: 'B', sets: ['S1'] },
  { name: 'C', sets: ['S2'] },
  { name: 'D', sets: ['S1', 'S3'] },
];

const sets = extractSets(elems);

<VennDiagram sets={sets} width={500} height={300} />;
with stored selection
const VennDiagramSelection = (props: any) => {
  [selection, setSelection] = React.useState(null as ISetLike<any> | null);

  return <VennDiagram {...props} selection={selection} onHover={setSelection} />;
};

<VennDiagramSelection sets={sets} width={500} height={300} />;

import { extractSets, renderVennDiagram } from '@upsetjs/bundle';

const elems = [
  { name: 'A', sets: ['S1', 'S2'] },
  { name: 'B', sets: ['S1'] },
  { name: 'C', sets: ['S2'] },
  { name: 'D', sets: ['S1', 'S3'] },
];

const sets = extractSets(elems);

renderVennDiagram(document.body, { sets, width: 500, height: 300 });
with stored selection
let selection = null;

function onHover(set) {
  selection = set;
  rerender();
}

function rerender() {
  const props = { sets, width: 500, height: 300, selection, onHover };
  renderVennDiagram(document.body, props);
}

rerender();
Karnaugh Maps
UpSet.js also has a variant of a Karnaugh Map for rendering set intersections in a dense matrix way.
import React from 'react';
import { KarnaughMap, extractSets, ISetLike } from '@upsetjs/react';

const elems = [
  { name: 'A', sets: ['S1', 'S2'] },
  { name: 'B', sets: ['S1'] },
  { name: 'C', sets: ['S2'] },
  { name: 'D', sets: ['S1', 'S3'] },
];

const sets = extractSets(elems);

<KarnaughMap sets={sets} width={550} height={300} />;
with stored selection
const KarnaughMapSelection = (props: any) => {
  [selection, setSelection] = React.useState(null as ISetLike<any> | null);

  return <KarnaughMap {...props} selection={selection} onHover={setSelection} />;
};

<KarnaughMapSelection sets={sets} width={550} height={300} />;
import { extractSets, renderKarnaughMap } from '@upsetjs/bundle';

const elems = [
  { name: 'A', sets: ['S1', 'S2'] },
  { name: 'B', sets: ['S1'] },
  { name: 'C', sets: ['S2'] },
  { name: 'D', sets: ['S1', 'S3'] },
];

const sets = extractSets(elems);

renderKarnaughMap(document.body, { sets, width: 550, height: 300 });
with stored selection
let selection = null;

function onHover(set) {
  selection = set;
  rerender();
}

function rerender() {
  const props = { sets, width: 550, height: 300, selection, onHover };
  renderKarnaughMap(document.body, props);
}

rerender();

Interactivity
By specifying onHover and selection UpSet.js is fully interactive. As an alternative there is also the onClick property.
Queries
Similar to the original UpSetR, UpSet.js allows to specify queries by a set of elements which are then highlighted in the plot. The first query is shown in full detail while others are shown using small indicators.
const queries = [
  { name: 'Q1', color: 'steelblue', elems: elems.filter(() => Math.random() > 0.7) },
  { name: 'Q2', color: 'red', elems: elems.filter(() => Math.random() > 0.8) },
];

render(document.body, { sets, width: 1000, height: 500, queries });

see also ![Open in CodePen][codepen]
Addons
Similar to the original UpSet and UpSetR, UpSet allows to render boxplot for showing numerical aggregates of sets and set combinations.
import { extractSets, render, boxplotAddon } from '@upsetjs/bundle';

const elems = [
  { name: '1', sets: ['one', 'two', 'three'], value: Math.random() },
  { name: '2', sets: ['one', 'two'], value: Math.random() },
  { name: '3', sets: ['one'], value: Math.random() },
  { name: '4', sets: ['two'], value: Math.random() },
  { name
