Threadwatch
A JVMTI agent that creates high-resolution (1000 samples/second) snapshots of thread state transitions along with a Java program to view the results.
Install / Use
/learn @toby1984/ThreadwatchREADME
ThreadWatch
This project contains
- a JVMTI monitoring agent that can be hooked into a JVM to capture Java thread state transitions and write them to a file using a proprietary binary format
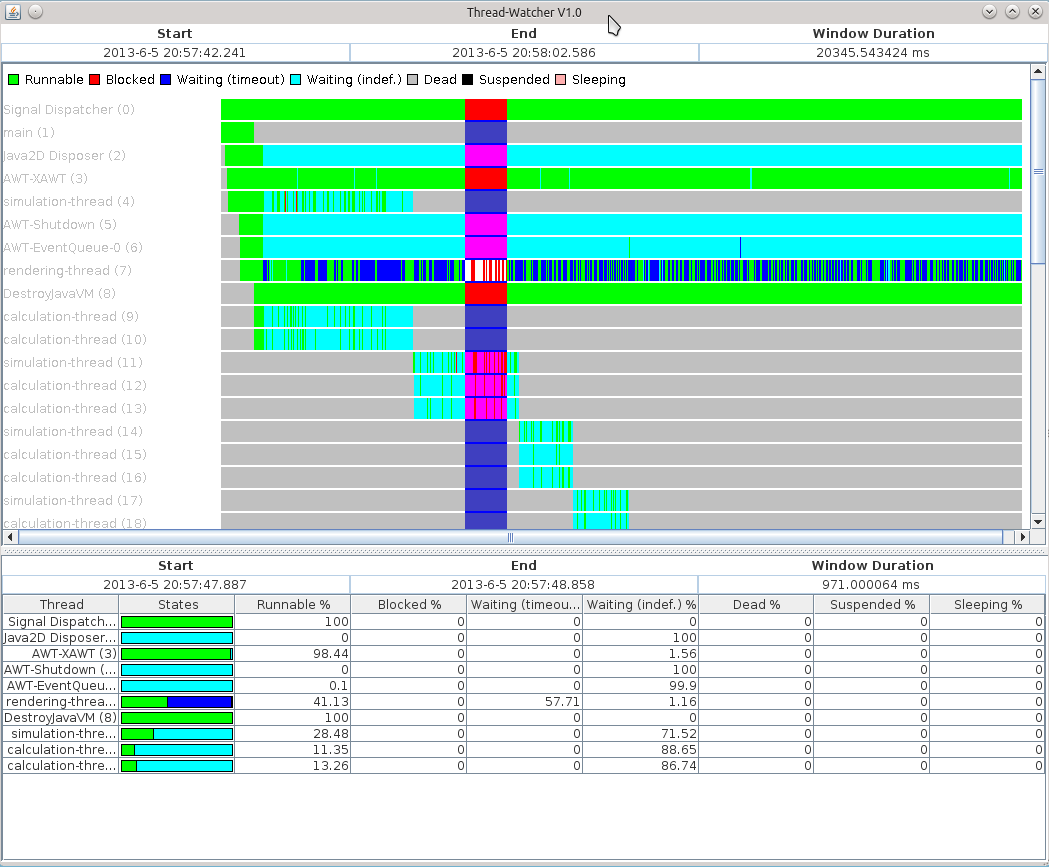
- a Swing application to plot a the thread states on a timeline
Requirements for compiling the JVMTI agent
Beware: I only tested compilation on my 64-bit Ubuntu 12.04. You may need additional/different compiler flags and/or paths for your environment.
- GNU C / make
- libpthread
- glibc
- Some Linux header files
- JVMTI header files matching the JDK you want to use the agent with
Note that the JVMTI header files are part of the regular JDK and usually reside in ${JAVA_HOME}/include and ${JAVA_HOME}/include/linux
Requirements for compiling the GUI application
- Apache Maven >= 2.2.1
- JDK 1.7+
Building the JVTI agent
To build, the agent:
Step 1: cd agent
Step 2: Adjust the Makefile to point to your JDK's C header files (${JAVA_HOME}/include and ${JAVA_HOME}/include/linux)
Step 3: make clean all
If all went well, you should find a shared library named agent.so inside the target folder.
Building the GUI application
Assuming you have a JDK and Maven 2.2.1+ installed, just run
mvn clean package
in the top-level folder. This should generate an executable JAR named threadwatcher.jar inside the target folder.
Running the JVMTI agent
The only way to run the agent is by passing it as a command-line option when starting the JVM, it's currently not possible to attach the agent to an already running JVM.
To start a JVM with the agent, use
java -agentpath:<path/to/agent.so>[=key=value[,key=value]] ....
Note that the agent will immediately start to capture thread state transitions and write them to a file.
The following options are understood by the agent:
<table> <tr> <td>Name</td> <td>Value</td> <td>Description</td> </tr> <tr> <td>verbose</td><td>ignored (but required!)</td><td>Enable verbose logging to std out</td> </tr> <tr> <td>file</td><td>Path to output file</td><td>File to write thread-state transitions to</td> </tr> <tr> <td>maxdelay</td><td>max. delay loop iterations</td><td><see below></td> </tr> </table>The 'maxdelay' options requires some explanation:
The agent tries to sample states of all running threads at least once every millisecond (= 1000 times per second). Since the actual wall-clock time needed to do this depends on the number of threads currently running, background load etc. there's no point in using a hard-coded sleep(X) inside this loop. Instead the agent continously measures the actual time needed for one iteration and the uses a PID regulator to dynamically adjust the sampling speed to match 1000 samples/sec. I calibrated the regulator on a i5-2500K and also tested it on some other machines but it MIGHT be that your machine is way more powerful than these and thus the default max. delay is still too low to not exceed the 1000 samples/sec.
A clear sign that your machine is "too" fast is (while running in verbose mode) that the number of samples keeps increasing way past the 1000 samples/sec. In this case, use the 'maxdelay' option and pass a value greater than the default (10000) to give the algorithm more leeway to slow-down the sampling loop.
Running the GUI application
The Maven build creates a self-executable JAR named 'threadwatcher.jar'.
To run the application, pass the output file of the agent as a command-line argument like so:
java -jar threadwatcher.jar <agent output file>
The GUI application supports the following keyboard controls to navigate the data:
<table> <tr> <td>Key</td> <td>Description</td> </tr> <tr> <td>a</td> <td>Go back 1/4 display resolution</td> <tr> <tr> <td>d</td> <td>Advance 1/4 display resolution</td> <tr> <tr> <td>w</td> <td>Zoom in</td> <tr> <tr> <td>s</td> <td>Zoom out</td> <tr> </table>- Left+click and drag inside the chart to select a time window to zoom into.
- Right+click and drag to select a time range to get statistics for. You can move the start/end of this region by left-clicking and dragging.
Related Skills
node-connect
343.3kDiagnose OpenClaw node connection and pairing failures for Android, iOS, and macOS companion apps
frontend-design
92.1kCreate distinctive, production-grade frontend interfaces with high design quality. Use this skill when the user asks to build web components, pages, or applications. Generates creative, polished code that avoids generic AI aesthetics.
openai-whisper-api
343.3kTranscribe audio via OpenAI Audio Transcriptions API (Whisper).
qqbot-media
343.3kQQBot 富媒体收发能力。使用 <qqmedia> 标签,系统根据文件扩展名自动识别类型(图片/语音/视频/文件)。
