Swarmstack
A Docker swarm-based starting point for operating highly-available containerized applications.
Install / Use
/learn @swarmstack/SwarmstackREADME
<img align="right" src="https://raw.githubusercontent.com/swarmstack/swarmstack/master/documentation/logos/swarmstack150x150.png"> A starting point for the installation, maintenance, operation, and monitoring of your highly-available Docker swarm-based containerized applications. Features a modern DevOps toolset (Prometheus / Alertmanager / Grafana) for monitoring and alerting. Optional: Docker swarm node management including automatic installation of Docker swarm nodes or onboarding of existing swarms, stable highly-available persistent storage for your containers, firewall management, HTTPS by default, LDAP and web-proxied network support, dynamic swarm service discovery and monitoring using swarm service labels, and other HA features that your applications can take advantage of. Installation requires only cut and paste of a few commands and editing some documented files.
<!-- TOC -->- swarmstack introduction video
- FEATURES
- WHY?
- REQUIREMENTS
- INSTALLATION
- MONITORING ALERTING AND LOGGING
- SCALING
- NETWORK URLs
- SCREENSHOTS
- Caddy Link Dashboard
- Grafana Dashboards List
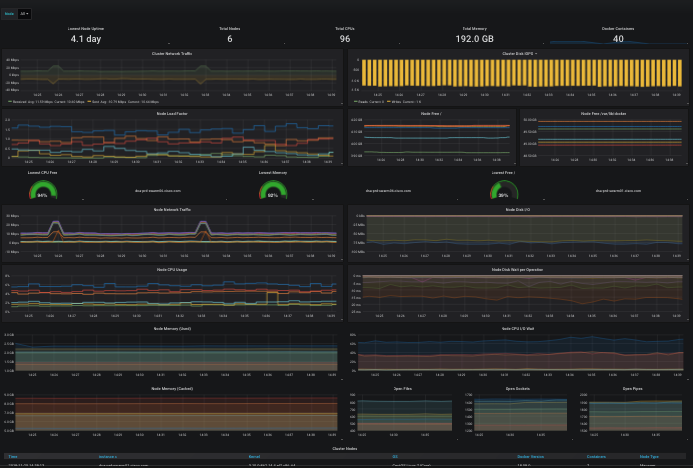
- Grafana - Docker Swarm Nodes
- Grafana - Docker Swarm Services
- Grafana - etcd
- Grafana - Portworx Cluster Status
- Grafana - Portworx Volume Status
- Grafana - Prometheus Stats
- Alertmanager
- Portainer - Cluster Visualizer
- Portainer - Dashboard
- Portainer - Stacks
- Prometheus - Graphs
- Prometheus - Alerts
- Prometheus - Targets
- VIDEOS
- CREDITS
Easily deploy and update Docker swarm nodes as you scale up from at least (3) baremetal servers, AWS/GCE/etc instances, virtual machine(s) or just a single macOS laptop if you really need to, which will host your monitored containerized applications.
Manage one or more Docker swarm clusters via ansible playbooks that can (optionally) help you install and maintain Docker swarm clusters and their nodes, automatically install Portworx Developer or Enterprise persistent storage for your application's HA container volumes replicated across your swarm nodes, and also automatically update firewall configurations on all of your nodes.
swarmstack includes a modern DevOps workflow for monitoring and alerting about your containerized applications running within Docker swarms, including monitoring and alerting of the cluster health itself as well as the health of your own applications. swarmstack installs and updates Prometheus + Grafana + Alertmanager. swarmstack also provides an optional installation of Portworx for persistent storage for containers such as databases that need storage that can move to another Docker swarm node instantly, or bring your own persistent storage layer for Docker (e.g. RexRay, or use local host volumes and add placement constraints to docker-compose.yml)
The included Grafana dashboards will help you examine the health of the cluster, and the same metrics pipeline can easily be used by your own applications and visualized in Grafana and/or alerted upon via Prometheus rules and sent to redundant Alertmanagers to perform slack/email/etc notifications.
For an overview of the flow of metrics into Prometheus, exploring metrics using the meager PromQL interface Prometheus provides, and ultimately using Grafana and other visualizers to create dashboards while using the Prometheus time-series database as a datasource, watch Monitoring, the Prometheus way, read at Prometheus: Monitoring at SoundCloud and watch How Prometheus Revolutionized Monitoring at SoundCloud.

FEATURES
A set of ansible playbooks and a docker-compose stack that:
- Tunes EL7 sysctls for optimal network performance
- (optional: Docker) Installs and configures a 3+ node Docker swarm cluster from minimal EL7 hosts (or use existing swarm)
- (optional: etcd) Installs and configures a 3-node etcd cluster, used by Portworx for cluster metadata
- (optional: Portworx) Installs and configures 1 or several 3-node Portworx high availability storage clusters across your nodes. Default: px-dev (px-developer free license) (licensing), 5M+ pulls and exceptionally stable
- (DevOps: swarmstack) Configures and deploys the swarmstack tool chain, including Prometheus and Pushgateway, redundant Alertmanager instances, Grafana, karma, and Portainer containers, and also installs NetData under systemd on each host. All tools are secured using HTTPS by a Caddy reverse-proxy.
Optional
- Errbot - Connect alerts to social rooms to not already natively supported by Alertmanager
- InfluxDB - [deprecated] Useful for longer-term Prometheus storage/retrieval in certain workloads
- Loki - Like Prometheus but for logs
- TeamPass - Secure collaborative team management for shared credentials
- Trickster - In-memory Prometheus data cache for frequently re-requested tsdb blocks (accelerator for Grafana if you have popular dashboards)
- VictoriaMetrics - Fast, cost-effective and scalable time series database, long-term remote storage for Prometheus
WHY?
A modern data-driven monitoring and alerting solution helps even the smallest of DevOps teams to develop and support containerized applications, and provides an ability to observe how applications perform over time, correlated to events occuring on the platform running them as well. Data-driven alerting makes sure the team knows when things go off-the-rails via alerts, but Prometheus also brings with it an easier way for you and your team to create alerts for applications, based on aggregated time-aware queries. For example:
alert: node_disk_fill_rate_6h
expr: predict_linear(node_filesystem_free{mountpoint="/"}[1h],
  6 * 3600) * on(instance) group_left(node_name) node_meta < 0
for: 1h
labels:
  severity: critical
annotations:
  description: Swarm node {{ $labels.node_name }} disk is going to fill up in 6h.
  summary: Disk fill alert for Swarm node '{{ $labels.node_name }}'
Learn how to add your own application metrics and alerts here: How to Export Prometheus Metrics from Just About Anything - Matt Layher, DigitalOcean or head straight to the existing Prometheus client libraries.
Grafana lets you visualize the metrics being collected into the Prometheus TSDB. You can build new chart/graph/table visualizations of your own application metrics using the same Prometheus data-source. Some default visualizations in Grafana are provided to help your team stay aware of the Docker swarm cluster health, and to dig into and explore what your containers and their volumes are doing:
Portworx provides a high-availability storage solution for containers that seeks to eliminate "ERROR: volume still attached to another node" situations that can be encountered with block device pooling storage solutions, situations can arise such as RexRay or EBS volumes getting stuck detaching from the old node and can't be mounted to the new node that a container moved to. Portworx replicates volumes across nodes in real-time so the data is already present on the new node when the new container starts up, speeding service recovery and reconvergence times.

REQUIREMENTS
There is a docker-compose-singlebox.yml stack that can be used to evaluate swarmstack on a single Docker swarm host without requiring etcd and Portworx or other persistent storage. Please see the INSTALLATION section for instructions on installing this singlebox version of swarmstack.
3 or more Enterprise Linux 7 (RHEL 7/CentOS 7) hosts (baremetal / VM or a combination), with each contributing (1) or more additional virtual or physical unused block devices or partitions to the Po
Related Skills
node-connect
345.9kDiagnose OpenClaw node connection and pairing failures for Android, iOS, and macOS companion apps
prose
345.9kOpenProse VM skill pack. Activate on any `prose` command, .prose files, or OpenProse mentions; orchestrates multi-agent workflows.
frontend-design
106.4kCreate distinctive, production-grade frontend interfaces with high design quality. Use this skill when the user asks to build web components, pages, or applications. Generates creative, polished code that avoids generic AI aesthetics.
openai-whisper-api
345.9kTranscribe audio via OpenAI Audio Transcriptions API (Whisper).
