Fxyt
Tiny, esoteric, stack-based, postfix, canvas colouring language with only 36 simple commands
Install / Use
/learn @susam/FxytREADME
FXYT
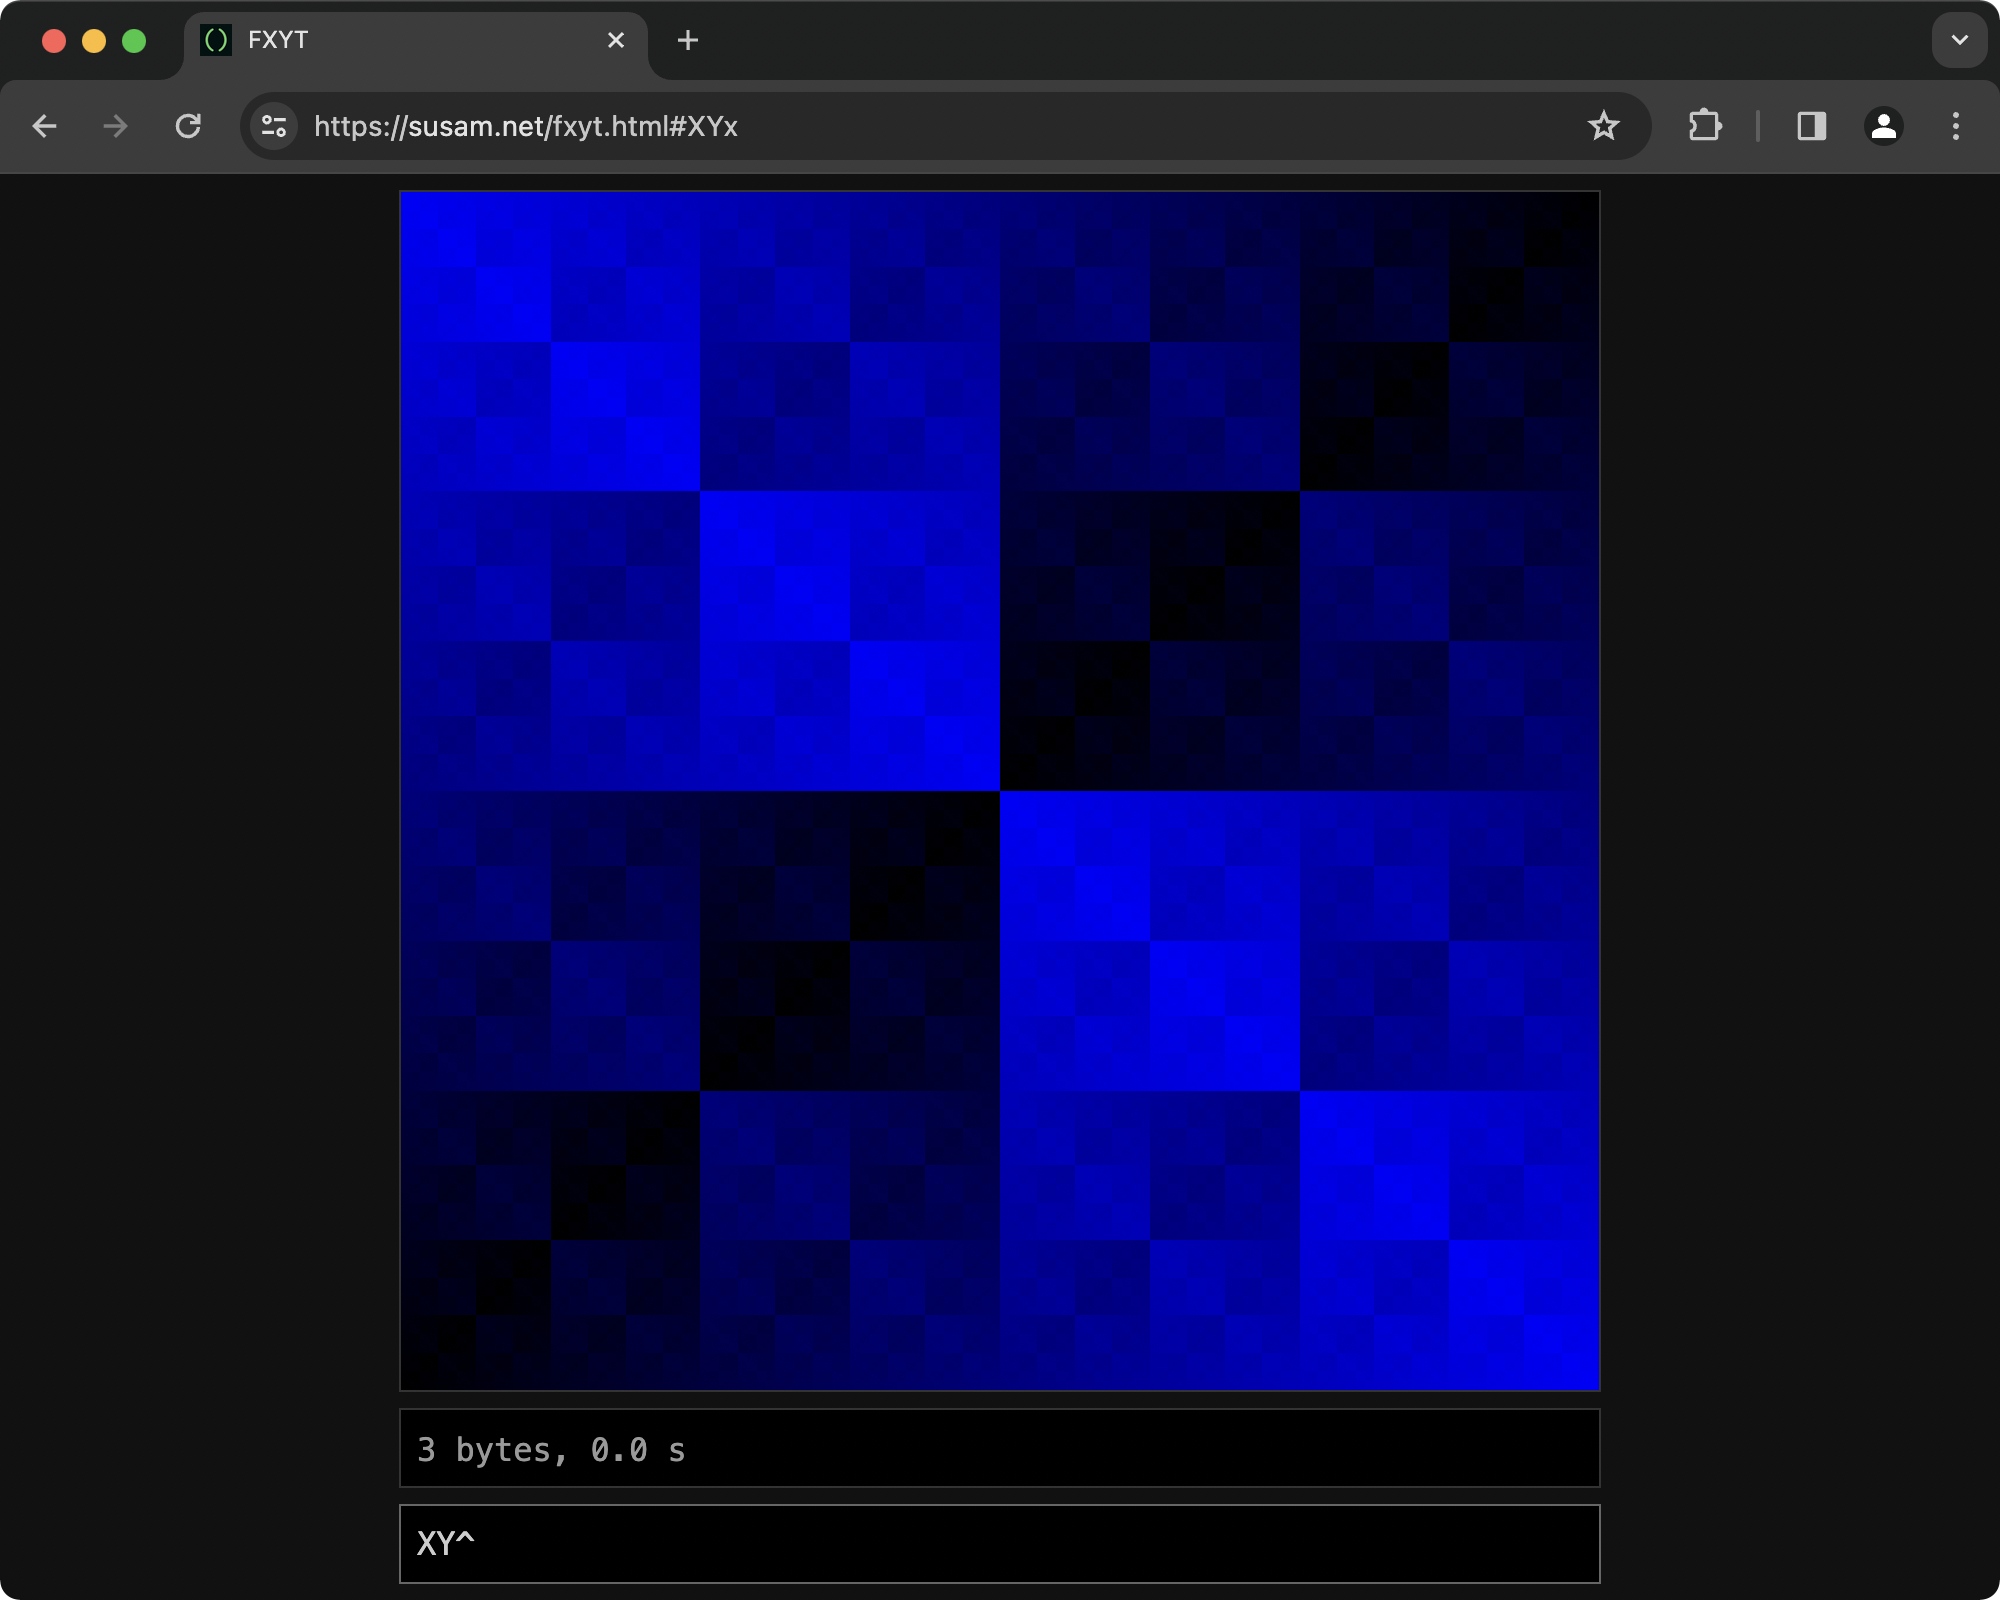
FXYT is a tiny canvas colouring language that consists of 36 simple stack-based commands. The input code is evaluated for each cell of a 256x256 graphical canvas. The colour of each cell is determined by the result of the evaluation. Here is an extremely simple FXYT code:
XY^
The result looks like this:
See some more demos here:
Visit https://susam.net/fxyt.html to write your own code!
This project is inspired by Martin Kleppe's Tixy project. While Tixy supports JavaScript expressions to determine the size and colour of circles in a 16x16 grid, FXYT comes with its own tiny, stack-based language that is written in postfix notation. Further, FXYT provides a 256x256 grid of cells each of which can be painted with an arbitrary colour determined by the result of the evaluation of the input code.
This project is intentionally minimal in nature. It is intended to be a creative code golfing playground that offers the challenge of crafting interesting visuals with a limited set of commands.
FXYT stands for function of x, y and t and it may be pronounced /fɒksɪt/ ("foxit").
Contents
- Coordinates
- Data Stack
- Loop Control Stack
- Colours
- Integers
- Arithmetic
- Division by Zero
- Comparison
- Inversion
- Bitwise Operations
- Clip
- Duplicate
- Pop
- Swap
- Rotate
- Loops
- Frame Interval
- Print Data Stack
- Idioms
- Common Mistakes
- Constraints
- Distributable Links
- FAQ
- Licence
- Support
- See Also
Coordinates
X
Enter the following code in the input field:
X
The output consists of a blue gradient spread across the canvas that gradually changes from black on the left hand side to bright blue on the right hand side.
The input code is evaluated for each cell in a 256x256 graphical canvas. Each cell has a coordinate which we represent here as (x, y) where x represents the column of the cell and y represents the row of the cell. The value of x varies from 0 to 255 as we move from the leftmost column to the rightmost column. Similarly, the value of y varies from 0 to 255 as we move from the bottommost row to the topmost row.
Thus the cell at the bottom-left corner of the canvas has the coordinate (0, 0). Similarly, the cell at the top-right corner of the canvas has the coordinate (255, 255).
The command X pushes the x-coordinate value of the current cell to
the data stack. When the above piece of code is evaluated for each
cell in the canvas, we get the result 0 for all cells at x = 0, the
result 1 for all cells at x = 1 and so on up to the final column where
the result is 255 for all cells at x = 255. The result obtained for
each cell determines the colour of each cell. In particular, in this
example, the result obtained for each cell determines the blue
component of the colour of each cell. As a result, all cells at x = 0
appear black and all cells at x = 255 appear bright blue.
Y
Now enter the following code:
Y
We get a blue gradient again. However, this time the blue gradient changes from black to bright blue as we move gradually from the bottommost row of cells at y = 0 to the topmost row at y = 255.
T
Finally, enter the following code:
T
Now we get an output that changes with time where the colour of the entire canvas changes from black to blue gradually in 256 iterations.
We call any input code that contains at least one occurrence of the
T command as time-dependent code. Such code is evaluated in 256
iterations represented with the time variable t that changes from t =
0 to t = 255. By default, there is a 100 ms interval between two
iterations. This interval is known as the frame interval.
Thus we can say that any time-dependent code is evaluated for each cell at the coordinate (x, y, t) where the x-value and y-value represent the location of the cell as explained before and t represents the current iteration.
The command T pushes the t-value of the current iteration to the
stack. When the above piece of code is evaluated, we get the result 0
for all cells at t = 0, the result 1 for all cells at t = 1 and so on
up to the final iteration when the result is 255 for all cells at t
= 255. As a result, the colour of all the cells change from dark to
bright blue gradually with each iteration.
Data Stack
The runtime environment contains exactly one data stack. Most FXYT commands manipulate this data stack. This data stack can contain at most 8 integer values. It is an error to push a value to the stack when the stack is full.
In the remainder of this document, sometimes we will provide examples of stack. Such examples will be written using an array notation where the elements that appear on the left are at the bottom of the stack and the elements on the right are at the top of the stack. For example, a stack that contains (from bottom to top) the values 10, 20, 30 and 40 will be written as [10, 20, 30, 40]. If we push 50 to this stack, we will write the resulting stack as [10, 20, 30, 40, 50].
Loop Control Stack
Apart from the data stack, there is a loop control stack. Unlike the
data stack, the loop control stack cannot be manipulated directly.
The loop control stack is an internal implementation detail of the two
looping commands [ and ] introduced later in this document. Each
entry in the loop control stack is a pair of integers: loop counter
and loop body position. This stack can contain at most 8 such
entries. As a result, while executing nested loops, at most 8 nested
loop bodies can be entered. It is an error to enter a loop that is 9
levels deep. To learn more about loops, see the section
Loops.
Colours
Commands of FXYT manipulate the data stack. As mentioned before, the input code is evaluated for each cell at (x, y) for time-independent code. If the input code is time-dependent, then it is evaluated for each cell at (x, y, t).
At the end of evaluation of the code for each cell, the top 3 values of the data stack is inspected to determine the red, blue and green (RGB) components of the colour of the cell. The value at the top of the data stack is used as the blue component, the second value from the top is the green component and the third value from the top is the red component.
Suppose the data stack looks like the following after the evaluation of the input code for a certain cell: [10, 20, 30, 40, 50]. Then the colour used to paint that cell in RGB notation is rgb(30, 40, 50).
For example, consider the following code:
YYY
When this code is evaluated for each cell of the canvas, the y-coordinate value of the cell is pushed to the data stack three times. At the end of each evaluation, the three values at the top of the data stack determine the RGB components of the colour. Since they are all equal, we get a shade of grey for each cell.
If less than three values exist on the data stack at the end of evaluation, then values for the missing RGB components are set to 0. For example, consider the following code:
YY
At the end of evaluation, the data stack contains only two values, so they decide the values of the blue and green components. The red component is set to 0. Thus each cell gets a shade of cyan. Finally consider this code:
Y
This time we get only one value on the data stack at the end of each evaluation and that only value determines the blue component of the colour of each cell.
If the data stack is empty at the end of evaluation, then all three components of the RGB colour is set to 0 and the corresponding cell is painted black. For example, consider the following code:
XP
The X command pushes the x-coordinate value to the data stack but
then the P command pops it off the data stack. Thus the data stack
becomes empty at the end of each evaluation. As a result, all cells
are painted black. In fact, when the input code is empty, the
evaluation of the empty code results in an empty stack thus leading to
a black canvas too.
The three values at the top of the data stack must be integers between 0 and 255, inclusive, because they are interpreted as the red, blue and green components of the resulting RGB colour. If any value among these three values is negative, it is an error. Similarly, if any of these values exceed 255, it is an error.
If an error occurs during the evaluation of the code, the error is displayed in the status panel and the entire canvas is painted red.
Integers
The commands X, Y and T push integer values to the data stack
that correspond to the x, y and t coordinates respectively of the
current cell. It is also possible to place arbitrary integers on the
stack by using N along with the digit commands introduced in this
section.
The following code pushes the integer 0 to the data stack:
N
The N command stands for nil which pushes the nil value (the zero
value) to the data stack.
A digit command like
