Monkit
A flexible process data collection, metrics, monitoring, instrumentation, and tracing client library for Go
Install / Use
/learn @spacemonkeygo/MonkitREADME
Package monkit is a flexible code instrumenting and data collection library.
See documentation at https://godoc.org/github.com/spacemonkeygo/monkit/v3
Software is hard. Like, really hard. Just the worst. Sometimes it feels like we've constructed a field where the whole point is to see how tangled we can get ourselves before seeing if we can get tangled up more while trying to get untangled.
Many software engineering teams are coming to realize (some slower than others) that collecting data over time about how their systems are functioning is a super power you can't turn back from. Some teams are calling this Telemetry, Observability, or describing it more basically through subcomponents such as distributed tracing, time-series data, or even just metrics. We've been calling it monitoring, but geez, I suppose if trends continue and you want to do this yourself your first step should be to open a thesaurus and pick an unused term.
I'm not here to tell you about our whole platform. Instead, I'm here to explain a redesign of a Go library for instrumenting your Go programs that we rather quietly launched a few years ago. If you are already using version 1 of our old library, we're sorry, but we rewrote it from scratch and renamed it to monkit. This one (this one!) is better - you should switch!
I'm going to try and sell you as fast as I can on this library.
Example usage
package main

import (
  "context"
  "fmt"
  "log"
  "math/rand"
  "net/http"
  "time"

  "github.com/spacemonkeygo/monkit/v3"
  "github.com/spacemonkeygo/monkit/v3/environment"
  "github.com/spacemonkeygo/monkit/v3/present"
)

var mon = monkit.Package()

func main() {
  environment.Register(monkit.Default)

  go http.ListenAndServe("127.0.0.1:9000", present.HTTP(monkit.Default))

  for {
    time.Sleep(time.Second)
    log.Println(DoStuff(context.Background()))
  }
}

func DoStuff(ctx context.Context) (err error) {
  defer mon.Task()(&ctx)(&err)

  result, err := ComputeThing(ctx, 1, 2)
  if err != nil {
    return err
  }

  fmt.Println(result)
  return
}

func ComputeThing(ctx context.Context, arg1, arg2 int) (res int, err error) {
  defer mon.Task()(&ctx)(&err)

  timer := mon.Timer("subcomputation").Start()
  res = arg1 + arg2
  timer.Stop()

  if res == 3 {
    mon.Event("hit 3")
  }

  mon.BoolVal("was-4").Observe(res == 4)
  mon.IntVal("res").Observe(int64(res))
  mon.DurationVal("took").Observe(time.Second + time.Duration(rand.Intn(int(10*time.Second))))
  mon.Counter("calls").Inc(1)
  mon.Gauge("arg1", func() float64 { return float64(arg1) })
  mon.Meter("arg2").Mark(arg2)

  return arg1 + arg2, nil
}
Metrics
We've got tools that capture distribution information (including quantiles) about int64, float64, and bool types. We have tools that capture data about events (we've got meters for deltas, rates, etc). We have rich tools for capturing information about tasks and functions, and literally anything that can generate a name and a number.
Almost just as importantly, the amount of boilerplate and code you have to write to get these features is very minimal. Data that's hard to measure probably won't get measured.
This data can be collected and sent to Graphite or any other time-series database.
Here's a selection of live stats from one of our storage nodes:
env.os.fds      120.000000
env.os.proc.stat.Minflt 81155.000000
env.os.proc.stat.Cminflt        11789.000000
env.os.proc.stat.Majflt 10.000000
env.os.proc.stat.Cmajflt        6.000000
...

env.process.control     1.000000
env.process.crc 3819014369.000000
env.process.uptime      163225.292925
env.runtime.goroutines  52.000000
env.runtime.memory.Alloc        2414080.000000
...

env.rusage.Maxrss       26372.000000
...

sm/flud/csl/client.(*CSLClient).Verify.current  0.000000
sm/flud/csl/client.(*CSLClient).Verify.success  788.000000
sm/flud/csl/client.(*CSLClient).Verify.error volume missing     91.000000
sm/flud/csl/client.(*CSLClient).Verify.error dial error 1.000000
sm/flud/csl/client.(*CSLClient).Verify.panics   0.000000
sm/flud/csl/client.(*CSLClient).Verify.success times min        0.102214
sm/flud/csl/client.(*CSLClient).Verify.success times avg        1.899133
sm/flud/csl/client.(*CSLClient).Verify.success times max        8.601230
sm/flud/csl/client.(*CSLClient).Verify.success times recent     2.673128
sm/flud/csl/client.(*CSLClient).Verify.failure times min        0.682881
sm/flud/csl/client.(*CSLClient).Verify.failure times avg        3.936571
sm/flud/csl/client.(*CSLClient).Verify.failure times max        6.102318
sm/flud/csl/client.(*CSLClient).Verify.failure times recent     2.208020
sm/flud/csl/server.store.avg    710800.000000
sm/flud/csl/server.store.count  271.000000
sm/flud/csl/server.store.max    3354194.000000
sm/flud/csl/server.store.min    467.000000
sm/flud/csl/server.store.recent 1661376.000000
sm/flud/csl/server.store.sum    192626890.000000
...
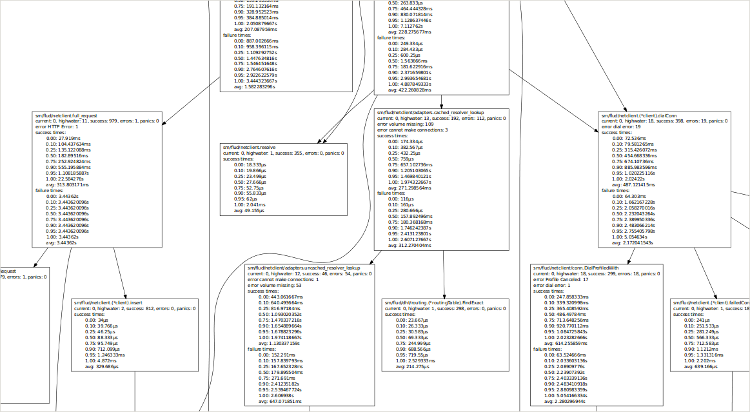
Call graphs
This library generates call graphs of your live process for you.
These call graphs aren't created through sampling. They're full pictures of all of the interesting functions you've annotated, along with quantile information about their successes, failures, how often they panic, return an error (if so instrumented), how many are currently running, etc.
The data can be returned in dot format, in json, in text, and can be about just the functions that are currently executing, or all the functions the monitoring system has ever seen.
Here's another example of one of our production nodes:
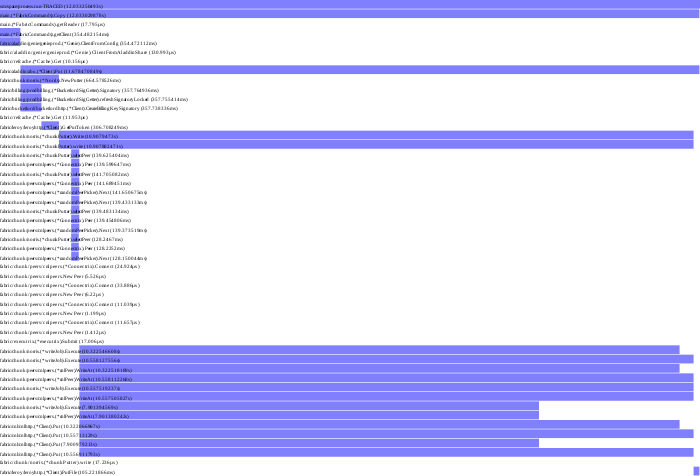
Trace graphs
This library generates trace graphs of your live process for you directly, without requiring standing up some tracing system such as Zipkin (though you can do that too).
Inspired by Google's Dapper and Twitter's Zipkin, we have process-internal trace graphs, triggerable by a number of different methods.
You get this trace information for free whenever you use Go contexts and function monitoring. The output formats are svg and json.
Additionally, the library supports trace observation plugins, and we've written a plugin that sends this data to Zipkin.
History
Before our crazy Go rewrite of everything (and before we had even seen Google's Dapper paper), we were a Python shop, and all of our "interesting" functions were decorated with a helper that collected timing information and sent it to Graphite.
When we transliterated to Go, we wanted to preserve that functionality, so the first version of our monitoring package was born.
Over time it started to get janky, especially as we found Zipkin and started adding tracing functionality to it. We rewrote all of our Go code to use Google contexts, and then realized we could get call graph information. We decided a refactor and then an all-out rethinking of our monitoring package was best, and so now we have this library.
Aside about contexts
Sometimes you really want callstack contextual information without having to pass arguments through everything on the call stack. In other languages, many people implement this with thread-local storage.
Example: let's say you have written a big system that responds to user requests. All of your libraries log using your log library. During initial development everything is easy to debug, since there's low user load, but now you've scaled and there's OVER TEN USERS and it's kind of hard to tell what log lines were caused by what. Wouldn't it be nice to add request ids to all of the log lines kicked off by that request? Then you could grep for all log lines caused by a specific request id. Geez, it would suck to have to pass all contextual debugging information through all of your callsites.
Google solved this problem by always passing a context.Context interface
through from call to call. A Context is basically just a mapping of arbitrary
keys to arbitrary values that users can add new values for. This way if you
decide to add a request context, you can add it to your Context and then all
callsites that descend from that place will have the new data in their contexts.
It is admittedly very verbose to add contexts to every function call. Painfully so. I hope to write more about it in the future, but Google also wrote up their thoughts about it, which you can go read. For now, just swallow your disgust and let's keep moving.
Motivating program
Let's make a super simple Varnish clone. Open up gedit! (Okay just kidding, open whatever text editor you want.)
For this motivating program, we won't even add the caching, though there's comments for where to add it if you'd like. For now, let's just make a barebones system that will proxy HTTP requests. We'll call it VLite, but maybe we should call it VReallyLite.
package main

import (
  "flag"
  "net/http"
  "net/http/httputil"
  "net/url"
)

type VLite struct {
  target *url.URL
  proxy  *httputil.ReverseProxy
}

func NewVLite(target *url.URL) *VLite {
  return &VLite{
	  target: target,
	  proxy:  httputil.NewSingleHostReverseProxy(target),
  }
}

func (v *VLite) Proxy(w http.ResponseWriter, r *
Related Skills
tmux
345.9kRemote-control tmux sessions for interactive CLIs by sending keystrokes and scraping pane output.
diffs
345.9kUse the diffs tool to produce real, shareable diffs (viewer URL, file artifact, or both) instead of manual edit summaries.
terraform-provider-genesyscloud
Terraform Provider Genesyscloud
blogwatcher
345.9kMonitor blogs and RSS/Atom feeds for updates using the blogwatcher CLI.
