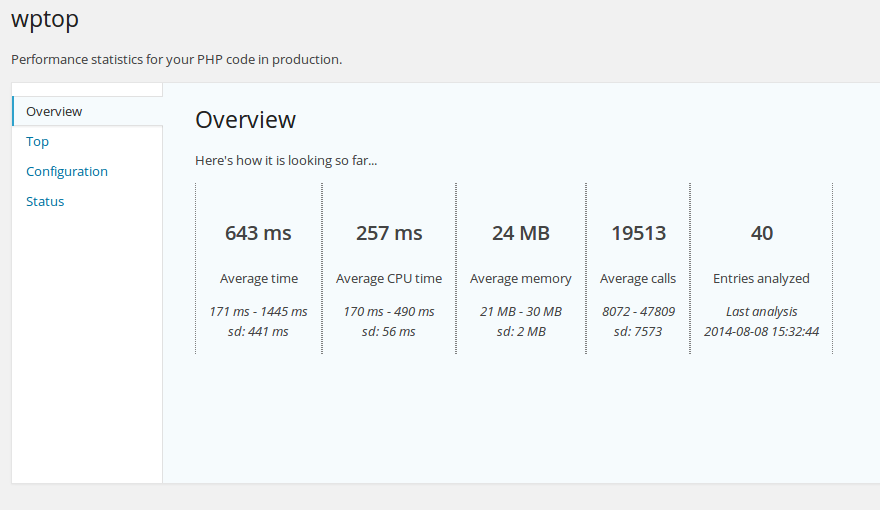
Wptop
Performance statistics for your PHP code in production for WordPress.
Install / Use
/learn @soulseekah/WptopREADME
top for WordPress
An XHProf-based WordPress code profiler. Gives you real-time overview of your WordPress application's performance and can be used in production due to very low overhead. Find out your slow pages and functions, optimize and profit from faster WordPress websites.
Requires XHProf.
Installation
Since we need the profiler to kick in as early as possible, the following should be added to your wp-config.php soon after ABSPATH is available but before wp-settings.php is required.
It is safe to call wptop_enable in any practical place. Using it in index.php is, however, discouraged, since updates will erase your change.
/** Turn on real-time profiling using wptop */
require ABSPATH . 'wp-content/plugins/wptop/enable.php';
wptop_enable();
Configuration
wptop_enable accepts the following array parameters:
memory(bool) tells the profiler to gather memory information,trueby defaultcpu(bool) tells the profiler to gather CPU time data,falseby default, not recommended in productionbuiltins(bool) tells the profiler whether to profile built-in PHP functions or not,falseby default
So for example, wptop_enable( array( 'memory' => false, 'cpu' => false, 'builtins' => false ) ) will have the profiler not generate any memory data, CPU time data or profile built-in PHP functions. Sane defaults are recommended.
Notes
A profiled request will store at least 200kb of data in the database in raw format. A cronjob will clean these up freeing most of it.
