Q3dviewer
No description available
Install / Use
/learn @scomup/Q3dviewerREADME
![]()
![]()
![]()
q3dviewer is a library designed for quickly deploying a 3D viewer. It is based on Qt and provides efficient OpenGL items for displaying 3D objects (e.g., point clouds, cameras, and 3D Gaussians). You can use it to visualize your 3D data or set up an efficient viewer application. It is inspired by PyQtGraph but focuses more on efficient 3D rendering.
To show how to use q3dviewer as a library, we also provide some very useful tools.
Installation
For library usage only:
pip install q3dviewer
For GUI tools (cloud_viewer, film_maker, etc.):
pip install "q3dviewer[tools]"
For Python 3.12+ (GUI tools):
pipx install "q3dviewer[tools]"
pipx ensurepath
source ~/.bashrc
Note for Windows Users
- Ensure that you have a Python 3 environment set up:
- Download and install Python 3 from the official Python website.
- During installation, make sure to check the "Add Python to PATH" option.
Note for Linux Users
If you encounter an error related to loading the shared library libxcb-cursor.so.0 on Ubuntu 20.04 or 22.04, please install libxcb-cursor0:
sudo apt-get install libxcb-cursor0
Tools
Once installed, you can directly use the following tools:
1. Cloud Viewer
A tool for visualizing point cloud files (LAS, PCD, PLY, E57). Launch it by executing the following command in your terminal:
cloud_viewer
Alternatively, if the path is not set (though it's not recommended):
python3 -m q3dviewer.tools.cloud_viewer
Basic Operations
📁 Load Files - Drag and drop files into the viewer
- Point clouds: .pcd, .ply, .las, .e57
- Mesh files: .stl
📏 Measure Distance - Interactive point measurement
Ctrl + Left Click: Add measurement pointCtrl + Right Click: Remove last point- Total distance displayed automatically
🎥 Camera Controls - Navigate the 3D scene
Double Click: Set camera center to pointRight Drag: Rotate viewLeft Drag: Pan viewMouse Wheel: Zoom in/out
⚙️ Settings - Press M to open settings window
- Adjust visualization properties
For example, you can download and view point clouds of Tokyo in LAS format from the following link:

Mesh Support - Starting from version 1.2.4, mesh files (.stl) are now supported.

2. ROS Viewer
A high-performance SLAM viewer compatible with ROS, serving as an alternative to RVIZ.
roscore &
ros_viewer
3. Film Maker
Would you like to create a video from point cloud data? With Film Maker, you can easily create videos with simple operations. Just edit keyframes using the user-friendly GUI, and the software will automatically interpolate the keyframes to generate the video.
film_maker
Basic Operations
- File loading & viewpoint movement: Same as Cloud_Viewer
- Space key to add a keyframe.
- Delete key to remove a keyframe.
- Play button: Automatically play the video (pressing again will stop playback)
- Record checkbox: When checked, actions will be automatically recorded during playback
Film Maker GUI:

The demo video demonstrating how to use Film Maker utilizes the cloud data of Kyobashi Station Area located in Osaka, Japan.
4. Gaussian Viewer
A simple viewer for 3D Gaussians. See EasyGaussianSplatting for more information.
gaussian_viewer # Drag and drop your Gaussian file onto the window
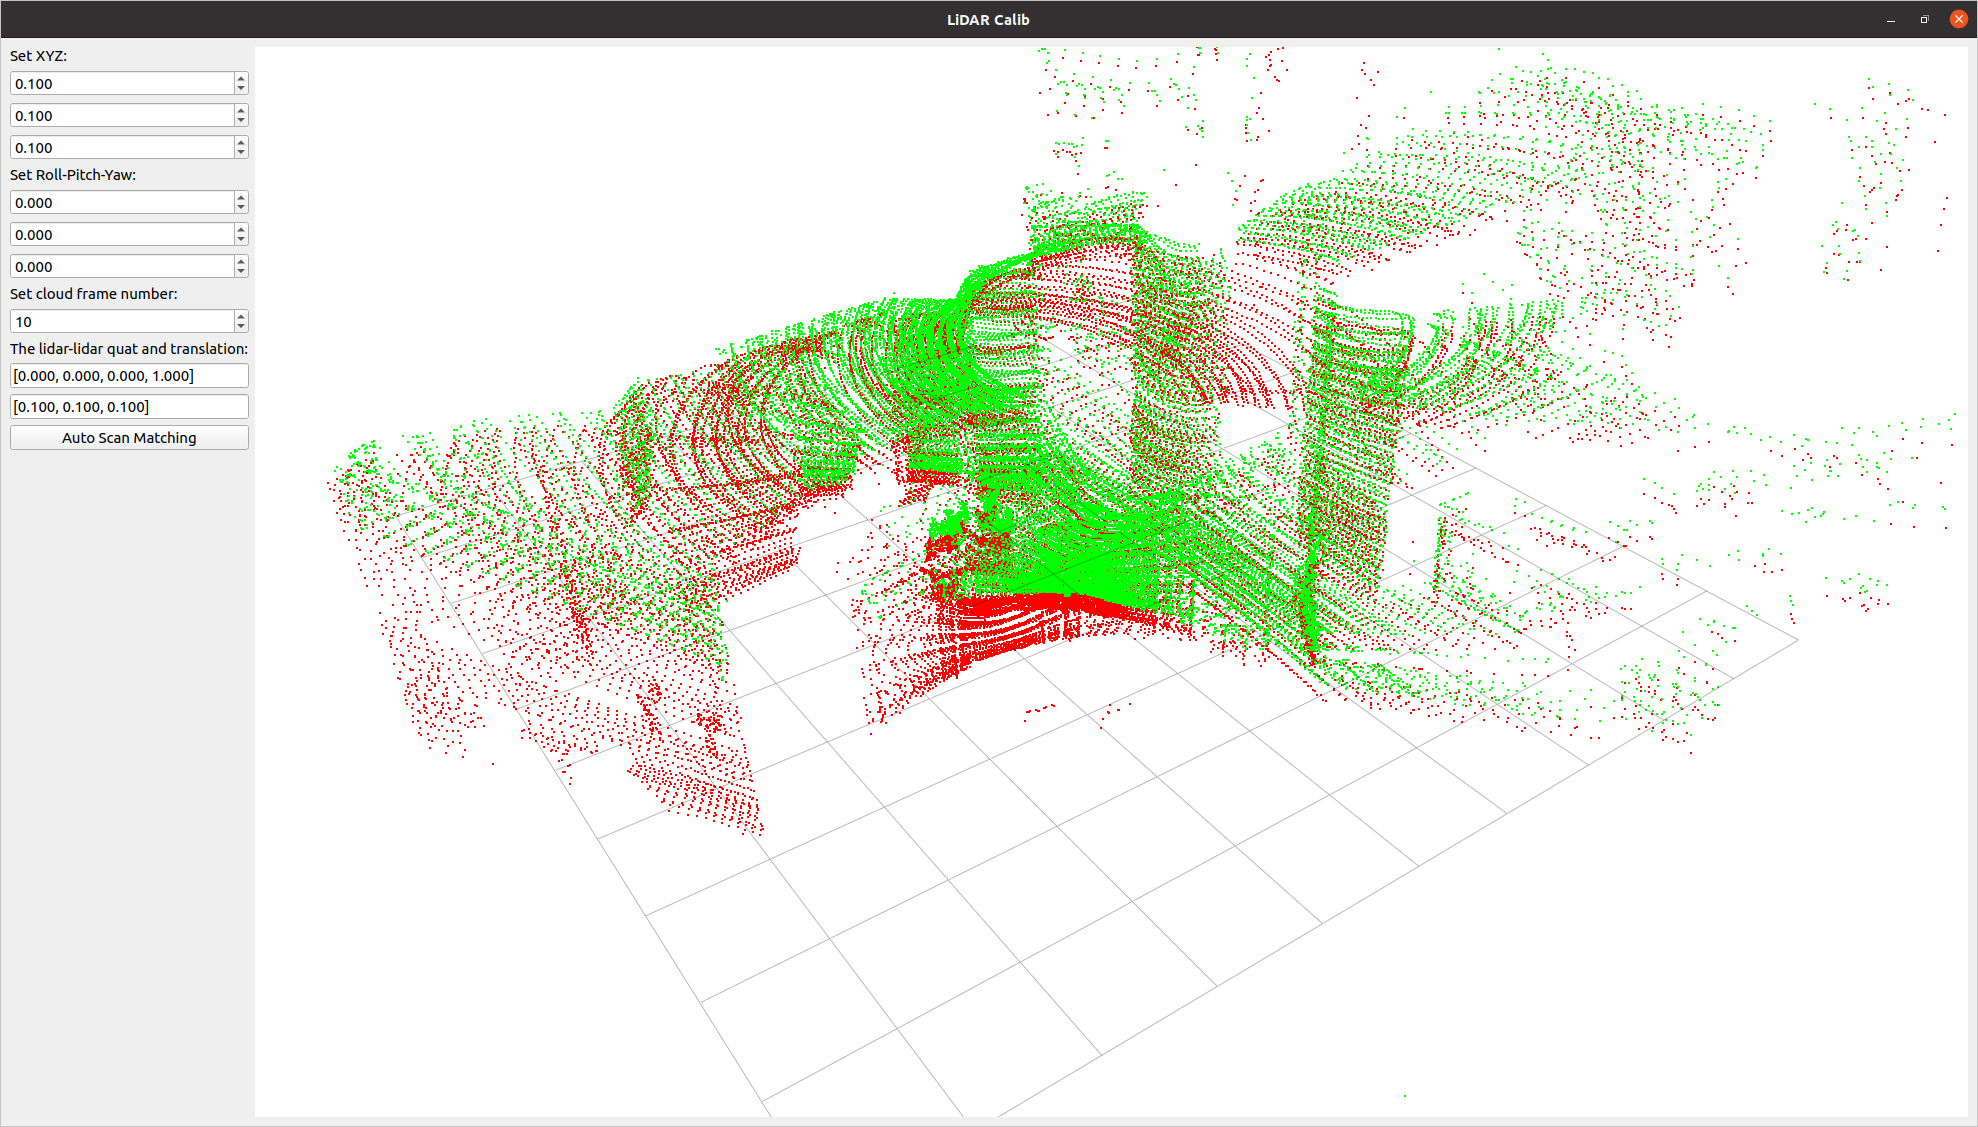
5. LiDAR-LiDAR Calibration Tools
A tool to compute the relative pose between two LiDARs. It allows for both manual adjustment in the settings screen and automatic calibration.
lidar_calib --lidar0=/YOUR_LIDAR0_TOPIC --lidar1=/YOUR_LIDAR1_TOPIC
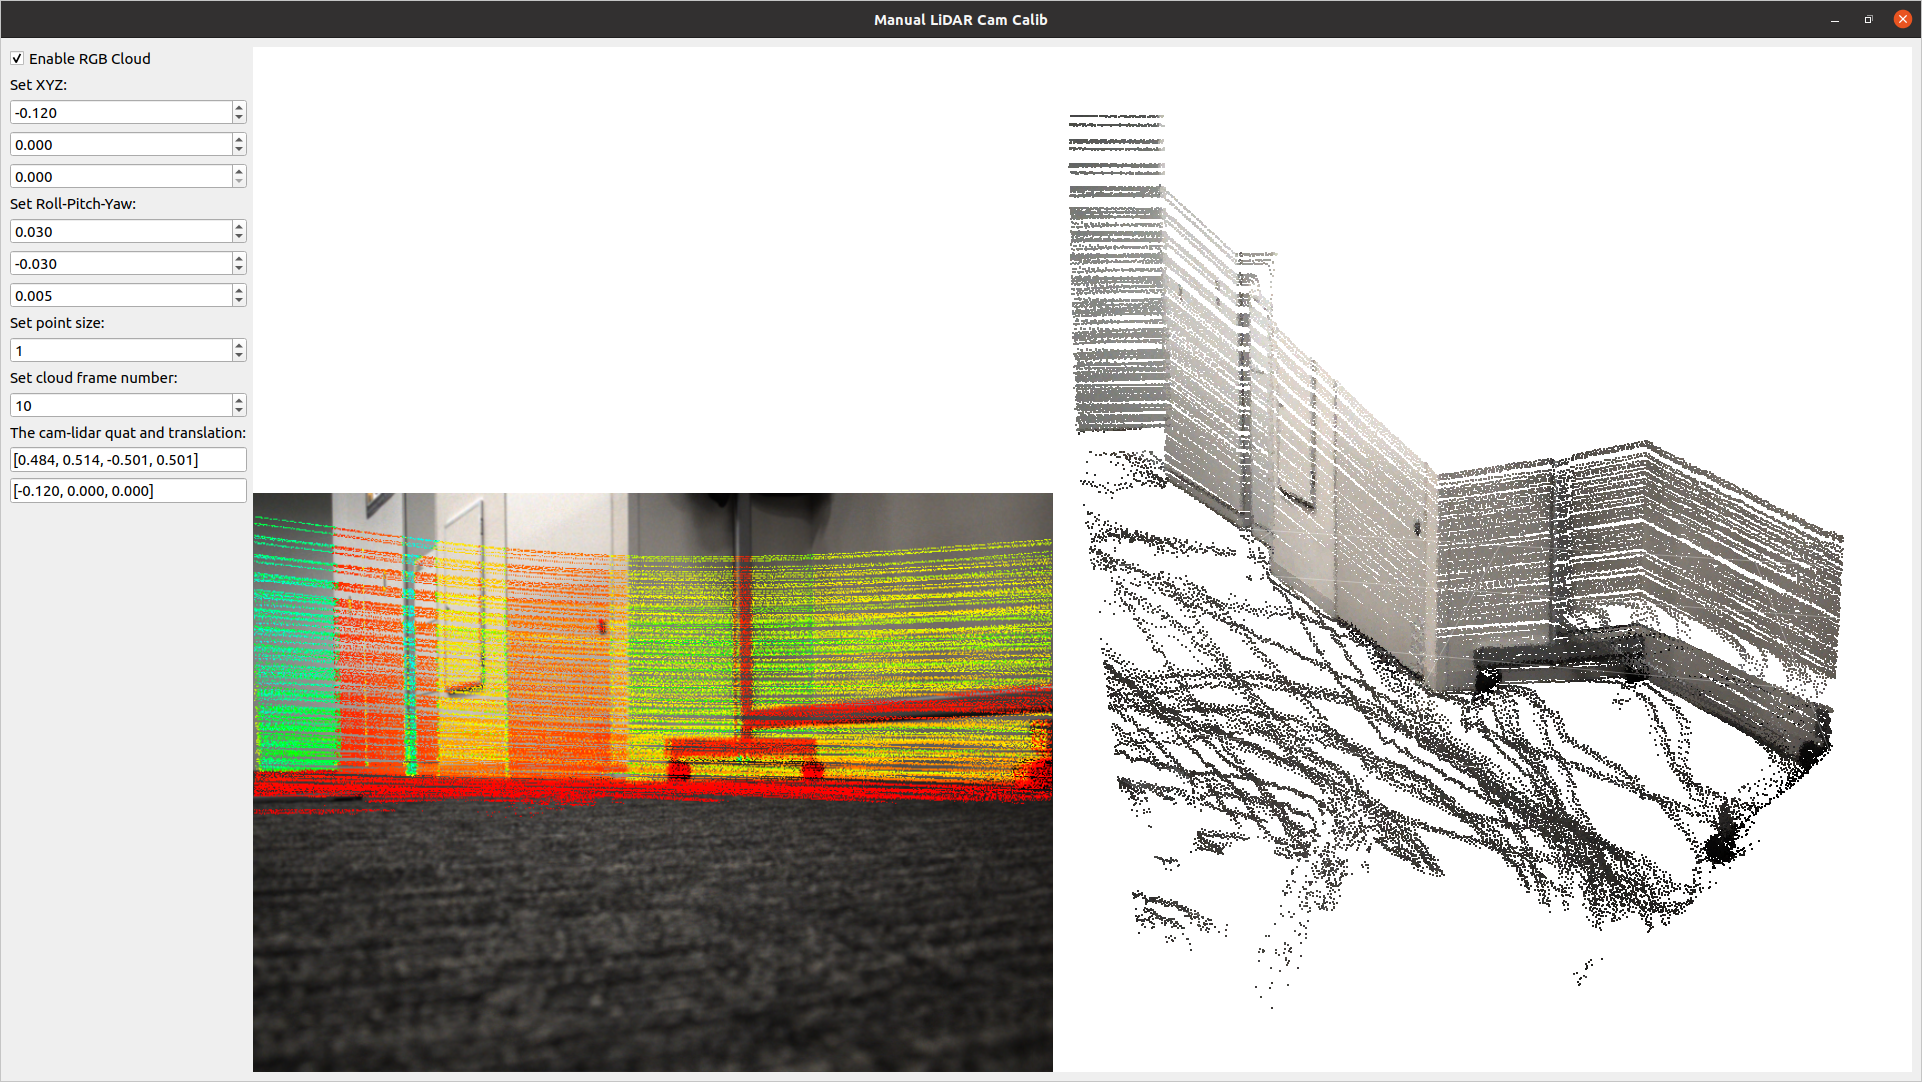
6. LiDAR-Camera Calibration Tools
A tool for calculating the relative pose between a LiDAR and a camera. It allows for manual adjustment in the settings screen and real-time verification of LiDAR point projection onto images.
lidar_cam_calib --lidar=/YOUR_LIDAR_TOPIC --camera=/YOUR_CAMERA_TOPIC --camera_info=/YOUR_CAMERA_INFO_TOPIC
Using as a Library
Using the examples above, you can easily customize and develop your own 3D viewer with q3dviewer. Below is a coding example.
Custom 3D Viewer
#!/usr/bin/env python3

import q3dviewer as q3d  # Import q3dviewer

def main():
    # Create a Qt application
    app = q3d.QApplication([])

    # Create various 3D items
    axis_item = q3d.AxisItem(size=0.5, width=5)
    grid_item = q3d.GridItem(size=10, spacing=1)

    # Create a viewer
    viewer = q3d.Viewer(name='example')

    # Add items to the viewer
    viewer.add_items({
        'grid': grid_item,
        'axis': axis_item,
    })

    # Show the viewer & run the Qt application
    viewer.show()
    app.exec()

if __name__ == '__main__':
    main()
q3dviewer provides the following 3D items:
- AxisItem: Displays coordinate axes or the origin position.
- CloudItem: Displays point clouds.
- CloudIOItem: Displays point clouds with input/output capabilities.
- GaussianItem: Displays 3D Gaussians.
- GridItem: Displays grids.
- ImageItem: Displays 2D images.
- Text2DItem: Displays 2D text.
- Text3DItem: Displays 3D test and mark.
- LineItem: Displays lines or trajectories.
Developing Custom Items
In addition to the standard 3D items provided, you can visualize custom 3D items with simple coding. Below is a sample:
from OpenGL.GL import *
import numpy as np
import q3dviewer as q3d
from q3dviewer.Qt.QtWidgets import QLabel, QSpinBox

class YourItem(q3d.BaseItem):
    def __init__(self):
        super(YourItem, self).__init__()
        # Necessary initialization

    def add_setting(self, layout):
        # Initialize the settings screen
        label = QLabel("Add your setting:")
        layout.addWidget(label)
        box = QSpinBox()
        layout.addWidget(box)

    def set_data(self, data):
        # Obtain the data you want to visualize
        pass

    def initialize_gl(self):
        # OpenGL initialization settings (if needed)
        pass

    def paint(self):
        # Visualize 3D objects using OpenGL
        pass
Enjoy using q3dviewer!
