Quiche
Google Chart Tools: Image Chart wrapper for Node.js
Install / Use
/learn @ryanrolds/QuicheREADME

Quiche
Easy to use Node.js wrapper for Google Image Charts - Chart Tools (deprecated by Google) that also supports Image-Charts, a drop-in replacement for Google Image Charts.
Examples
Pie chart

 var Quiche = require('quiche');

 var pie = new Quiche('pie');
 pie.setTransparentBackground(); // Make background transparent
 pie.addData(3000, 'Foo', 'FF0000');
 pie.addData(2900, 'Bas', '0000FF');
 pie.addData(1500, 'Bar', '00FF00');
 pie.setLabel(['Foo','Bas','Bar']); // Add labels to pie segments
 var imageUrl = pie.getUrl(true); // First param controls http vs. https
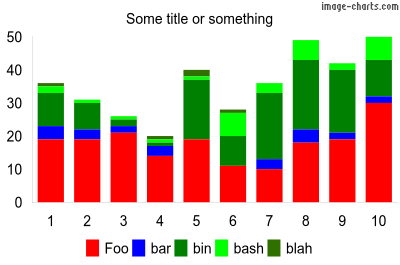
Bar chart
 var Quiche = require('quiche');

 var bar = new Quiche('bar');
 bar.setWidth(400);
 bar.setHeight(265);
 bar.setTitle('Some title or something');
 bar.setBarStacked(); // Stacked chart
 bar.setBarWidth(0);
 bar.setBarSpacing(6); // 6 pixles between bars/groups
 bar.setLegendBottom(); // Put legend at bottom
 bar.setTransparentBackground(); // Make background transparent

 bar.addData([19, 19, 21, 14, 19, 11, 10, 18, 19, 30], 'Foo', 'FF0000');
 bar.addData([4, 3, 2, 3, 0, 0, 3, 4, 2, 2], 'bar', '0000FF');
 bar.addData([10, 8, 2, 1, 18, 9, 20, 21, 19, 11], 'bin', '008000');
 bar.addData([2, 1, 1, 1, 1, 7, 3, 6, 2, 7], 'bash', '00FF00');
 bar.addData([1, 0, 0, 1, 2, 1, 0, 0, 0, 0], 'blah', '307000');

 bar.setAutoScaling(); // Auto scale y axis
 bar.addAxisLabels('x', ['1', '2', '3', '4', '5', '6', '7', '8', '9', '10']);

 var imageUrl = bar.getUrl(true); // First param controls http vs. https
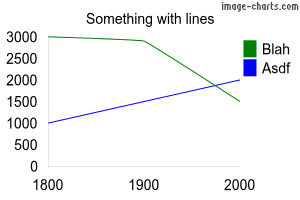
Line chart
 var quiche = require('quiche');

 var chart = quiche('line');
 chart.setTitle('Something with lines');
 chart.addData([3000, 2900, 1500], 'Blah', '008000');
 chart.addData([1000, 1500, 2000], 'Asdf', '0000FF');
 chart.addAxisLabels('x', ['1800', '1900', '2000']);
 chart.setAutoScaling();
 chart.setAxisRange('y', 500, 3500, 250);
 chart.setTransparentBackground();

 var imageUrl = chart.getUrl(true); // First param controls http vs. https
QR Code
 var quiche = require('quiche');

 var qr = quiche('qr');
 qr.setLabel('https://github.com/ryanrolds/quiche');
 qr.setWidth(100);
 qr.setHeight(100);

 var url = qr.getUrl(true); // First param controls http vs. https
Note: currently not supported by Image-Charts
Documentation
Install
$ npm install quiche
API
Supported charts
- line
- pie
- bar
- qr
All charts
- chart.setWidth(width [number]);
- chart.setHeight(height [number]);
- chart.setTitle(title [string]);
- chart.setTitleColor(color [hex color]);
- chart.setTitleSize(size [number]);
- chart.setTitleRight();
- chart.setTitleLeft();
- chart.setLegendOrder(order [string])
- chart.setLegendLeft();
- chart.setLegendRight();
- chart.setLegendBottom();
- chart.setLegendTop();
- chart.setLegendVertical();
- chart.setLegendHorizontal();
- chart.setLegendHidden();
- chart.setLegendSize([number]);
- chart.setTransparentBackground();
- chart.addAxisLabels(axis [x | y | r], labels [array]);
- chart.addData(data [number | array], label [string], color [hex color]);
- chart.setAutoScaling();
- chart.setHostname(hostname [string]);
- e.g. 'chart.googleapis.com' to use the deprecated Google Image Charts API (default is 'image-charts.com')
- chart.getUrl(https [boolean]); // true = https, false = http
- chart.getReq(https [boolean], callback [function]);
- chart.getPostReq(https [boolean], callback [function]);
Pie
- pie.set3D();
- pie.setLabel();
- pie.addPercent();
Bar
- bar.addData();
- bar.setBarWidth([number]);
- bar.setBarSpacing([number]);
- bar.setBarVertical();
- bar.setBarHorizontal();
- bar.setBarGrouped();
- bar.setBarStacked();
- bar.setBarOverlapped();
- bar.setAxisRange(axis ["x", "r", "y"], start [number], end [number], step [number]);
Line
- line.addData(data [number | array], label [string], color [hex color], thickness [number], line length [number], space length [number]);
- line.setSparklines();
- line.setXY();
- line.setAxisRange(axis ["x", "r", "y"], start [number], end [number], step [number]);
QR Code
- qr.setLabel(data [string]);
- qr.setEncoding(encoding [UTF-8 | Shift_JS | ISO-8859-1]);
- qr.setErrorCorrectionLevel(level [string]) // https://developers.google.com/chart/infographics/docs/qr_codes
- qr.setMargin(margin [number]); // Margin around graphic
- qr.setWidth(width [number]);
- qr.setHeight(height [number]);
- qr.getUrl(https [boolean]); // true = https, false = http
Features
- Pie charts
- Bar charts
- Auto scaling
TODO
- Documentation
- More chart types
- Better confict handling
Related Skills
node-connect
343.3kDiagnose OpenClaw node connection and pairing failures for Android, iOS, and macOS companion apps
frontend-design
92.1kCreate distinctive, production-grade frontend interfaces with high design quality. Use this skill when the user asks to build web components, pages, or applications. Generates creative, polished code that avoids generic AI aesthetics.
openai-whisper-api
343.3kTranscribe audio via OpenAI Audio Transcriptions API (Whisper).
qqbot-media
343.3kQQBot 富媒体收发能力。使用 <qqmedia> 标签,系统根据文件扩展名自动识别类型(图片/语音/视频/文件)。
