Sdaas
Simple machine learning tool in Python (>=3.7) computing an anomaly score of seismic waveform amplitudes. By using a pre-trained Isolation forest model, the program can be used for identification of outliers in semismic data, assign robustness weights, or check instruments and metadata errors
Install / Use
/learn @rizac/SdaasREADME
<img align="left" height="30" src="https://www.gfz-potsdam.de/fileadmin/gfz/medien_kommunikation/Infothek/Mediathek/Bilder/GFZ/GFZ_Logo/GFZ-Logo_eng_RGB.svg"> Sdaas <img align="right" height="50" src="https://www.gfz-potsdam.de/fileadmin/gfz/GFZ_Wortmarke_SVG_klein_en_edit.svg">
|Jump to: | Installation | Usage | Maintenance | Citation | | - | - | - | - | - |
<!-- **S**eismic **D**ata (and metadata) **A**mplitude **A**nomaly **S**core -->Simple, general and flexible tool for the identification of anomalies in seismic waveform amplitude, e.g.:
- recording artifacts (e.g., anomalous noise, peaks, gaps, spikes)
- sensor problems (e.g. digitizer noise)
- metadata field errors (e.g. wrong stage gain in StationXML)
For any waveform analyzed, the program computes an amplitude anomaly score in [0, 1] representing the degree of belief of a waveform to be an outlier. The score can be used:
- in any processing pipeline to
- pre-filter malformed data via a user-defined threshold
- assign robustness weights
- as station installation / metadata checker, exploiting the scores temporal trends. See e.g. Channel (a) in the figure: the abrupt onset/offset of persistently high anomaly scores roughly between March and May 2018 clearly indicates an installation problem that has been fixed
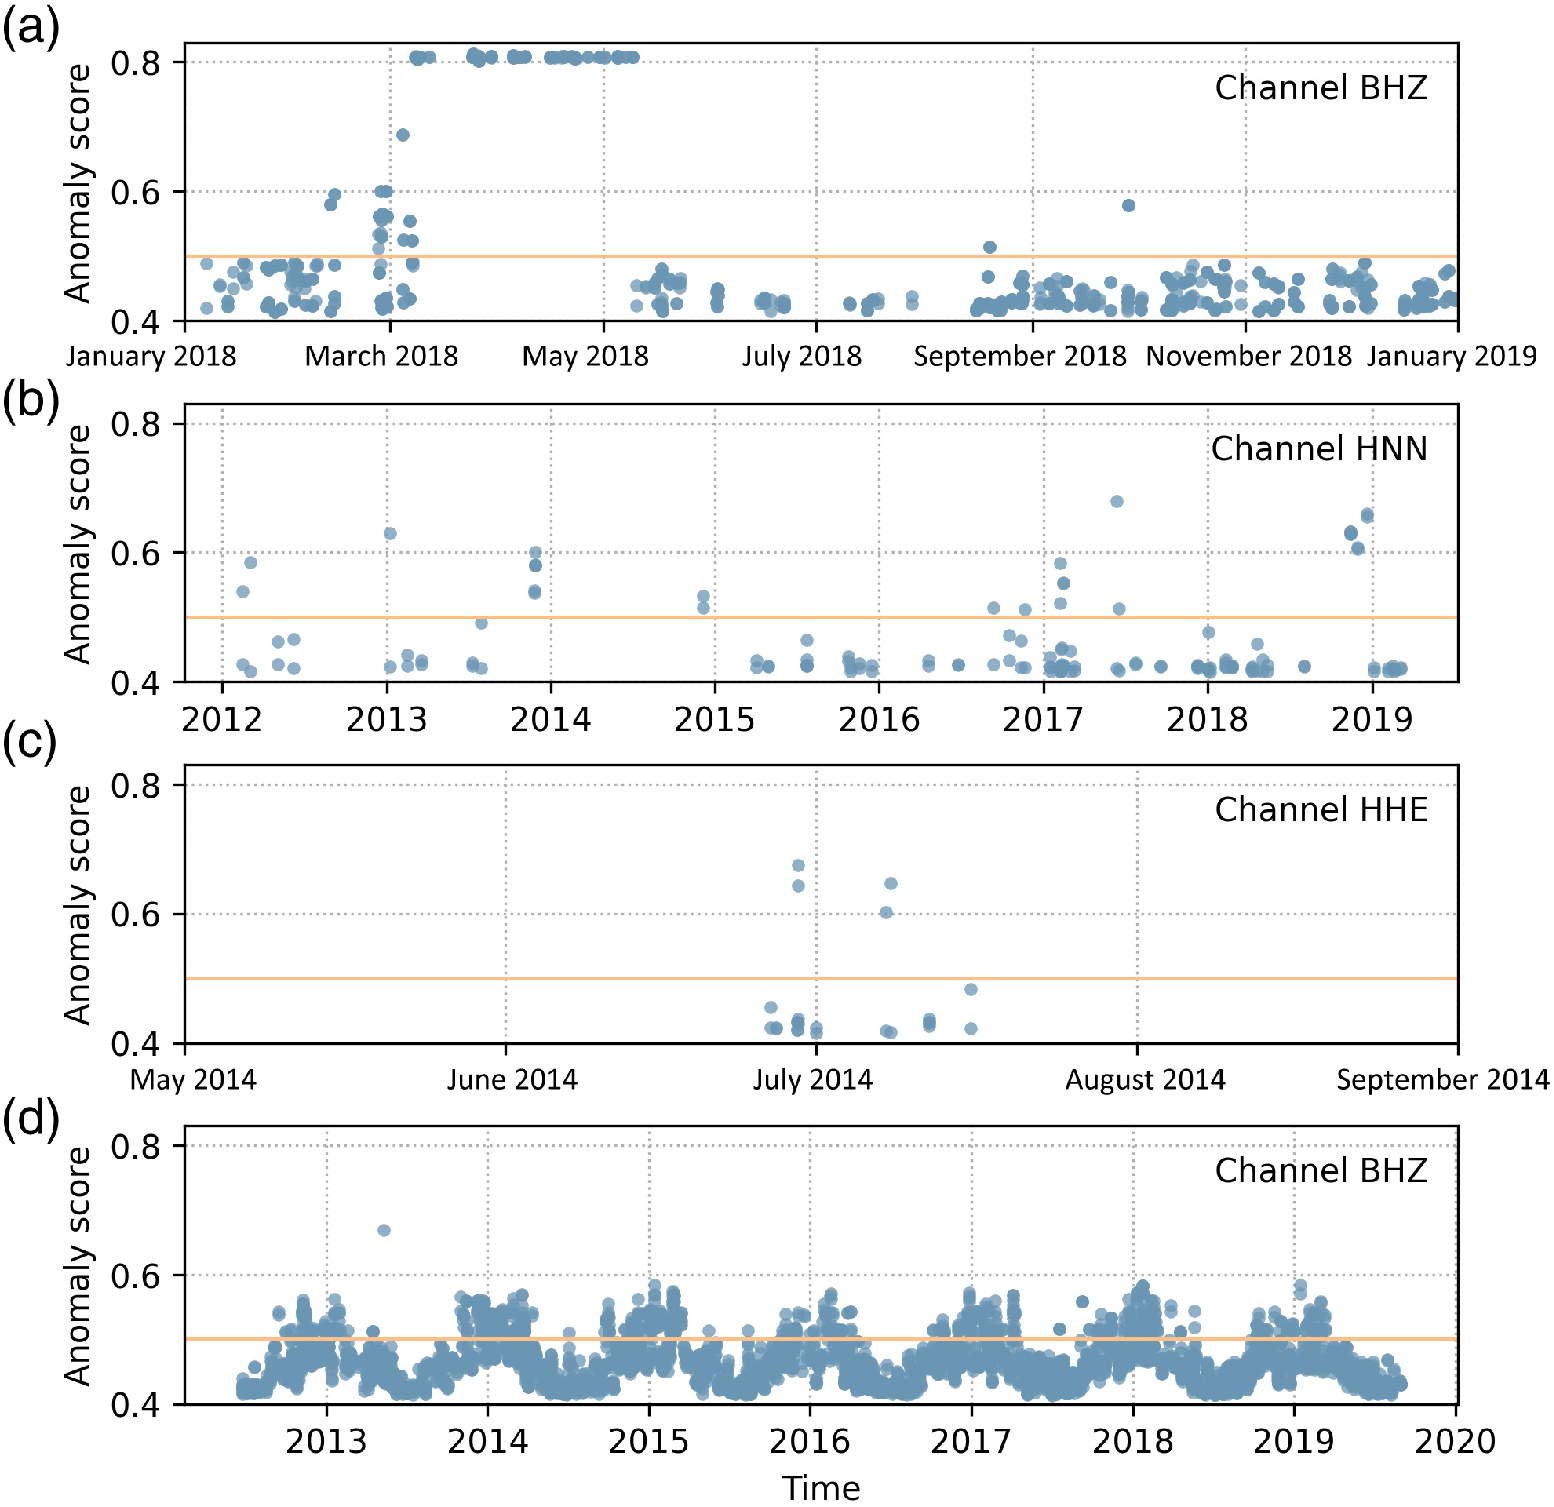 Anomaly scores for four different channels (a) to (d). Each dot represents a recorded waveform segment of variable length
Notes:
This program uses a machine learning algorithm specifically designed for outlier detection (Isolation forest) where
-
scores <= 0.5 can be safely interpreted in all applications as "no significant anomaly" (see Isolation Forest original paper - Liu et al. 2008 - for theoretical details)
-
extreme score values are virtually impossible by design. This has to be considered when setting a user defined threshold T to discard malformed waveforms. In many application, setting T between 0.7 and 0.75 has proven to be a good compromise between precision and recall (F1 score)
-
(Disclaimer) "False positives", i.e. relatively high anomaly scores even for well formed recordings have been sometimes observed in two specific cases:
- recordings from stations with extremely and abnormaly low noise level (e.g. borhole installations)
- recordings containing strong and close earthquakes. This is not a problem to check metadata errors, as the scores trend of several recordings from a given sensor / station will not be affected (except maybe for few sparse slightly higer scores), but has to be considered when filtering out segments in specific studies (e.g. with strong motion data): in this cases, setting a higher threshold is advisable. A model trained for accelerometers only (usually employed with these kind of recordings) is under study
Installation
Always work within a virtual environment. From a terminal, in the directory
where you cloned this repository (last argument of git clone),
-
create a virtual environment (once). Be sure you use Python>=3.7 (Type
python3 --versionto check):python3 -m venv .env -
activate it (to be done also every time you use this program):
source .env/bin/activate(then to deactivate, simply type ...
deactivateon the terminal).Update
pipandsetuptools(not mandatory, but in rare cases it could prevent errors during the installation):pip install --upgrade pip setuptools -
Install the program (one line command):
with requirements file:
pip install -r ./requirements.txt && pip install -e .or standard (use this mainly if you install sdaas on an already existing virtualenv and you are concerned about breaking existing code):
pip install "numpy>=1.15.4" && pip install -e .Notes:
-
The "standard" install actually checks the
setup.pyfile and avoids overwriting libraries already matching the required version. The downside is that you might use library version that were not tested -
-eis optional. With -e, you can update the installed program to the latest release by simply issuing agit pull -
although used to train, test and generate the underlying model,
<details> <summary>Reported scikit learn installation problems (click for details)</summary>scikit learnis not required for Security & maintainability limitations. If you want to install it, typepip install scikit-learn>=0.21.3or, in the standard installation you can include scikit learn withpip install .[dev]instead ofpip install .Due to the specific version to be installed, scikit might have problems installing.
Few hints here:
- you might need to preinstall
cython(pip install cython) - you might need to
brew install libomp, set the follwing env variables:export CC=/usr/bin/clang;export CXX=/usr/bin/clang++;export CPPFLAGS="$CPPFLAGS -Xpreprocessor -fopenmp";export CFLAGS="$CFLAGS -I/usr/local/opt/libomp/include";export CXXFLAGS="$CXXFLAGS -I/usr/local/opt/libomp/include";export LDFLAGS="$LDFLAGS -Wl,-rpath,/usr/local/opt/libomp/lib -L/usr/local/opt/libomp/lib -lomp" - and then install with the following flags:
pip install --verbose --no-build-isolation "scikit-learn==0.21.3"
(For any further detail, see scikit-learn installation page)
</details> - you might need to preinstall
-
Run tests (optional)
python -m unittest -fv
(-f is optional and means: stop at first failure, -v: verbose)
Usage
sdaas can be used as command line application or as library in your Python code
As command line application
After activating your virtual environment (see above) you can access the program as
command line application in your terminal by typing sdaas. The application
can compute the score(s) of a single miniSEED file, a directory of miniSEED files, or
a FDSN url (dataselect or station url).
Please type sdaas --help for details and usages not covered in the examples below,
such as computing scores from locally stored files
Examples
Compute scores of waveforms fetched from a FDSN URL:
>>> sdaas "http://geofon.gfz-potsdam.de/fdsnws/dataselect/1/query?net=GE&sta=EIL&cha=BH?&start=2019-01-01T00:00:00&end=2019-01-01T00:02:00" -v
[████████████████████████████████████████████████████████████████████████████████████████████████████████]100%  0d 00:00:00
id start end anomaly_score
GE.EIL..BHN 2019-01-01T00:00:09.100 2019-01-01T00:02:12.050 0.45
GE.EIL..BHE 2019-01-01T00:00:22.350 2019-01-01T00:02:00.300 0.45
GE.EIL..BHZ 2019-01-01T00:00:02.250 2019-01-01T00:02:03.550 0.45
(note: The paremeter -v / verbose
prints additional info before the scores table)
Compute scores from randomly selected segments of a given station and channel,
and provide also a user-defined threshold (parameter -th) which will also
append a column "class_label" (1 = outlier - assigned to the scores
greater than the threshold and 0 = inlier)
>>> sdaas "http://geofon.gfz-potsdam.de/fdsnws/station/1/query?net=GE&sta=EIL&cha=BH?&start=2019-01-01" -v -th 0.7
[██████████████████████████████████████████████████████████]100%  0d 00:00:00
id start end anomaly_score class_label
GE.EIL..BHN 2019-01-01T00:00:09.100 2019-01-01T00:02:12.050 0.45 0
GE.EIL..BHN 2019-10-16T18:48:11.700 2019-10-16T18:51:02.300 0.83 1
GE.EIL..BHN 2020-07-31T13:37:19.299 2020-07-31T13:39:41.299 0.45 0
GE.EIL..BHN 2021-05-16T08:25:38.100 2021-05-16T08:28:03.150 0.53 0
GE.EIL..BHN 2022-03-01T03:14:23.300 2022-03-01T03:17:01.750 0.45 0
GE.EIL..BHE 2019-01-01T00:00:22.350 2019-01-01T00:02:00.300 0.45 0
GE.EIL..BHE 2019-10-16T18:48:18.050 2019-10-16T18:51:09.650 0.83 1
GE.EIL..BHE 2020-07-31T13:37:08.599 2020-07-31T13:39:28.499 0.45 0
GE.EIL..BHE 2021-05-16T08:25:49.150 2021-05-16T08:28:14.800 0.49 0
GE.EIL..BHE 2022-03-01T03:14:26.050 2022-03-01T03:16:41.900 0.45 0
GE.EIL..BHZ 2019-01-01T00:00:02.250 2019-01-01T00:02:03.550 0.45 0
GE.EIL..BHZ 2019-10-16T18:48:24.800 2019-10-16T18:50:47.300 0.45 0
GE.EIL..BHZ 2020-07-31T13:37:08.249 2020-07-31T13:39:30.199 0.45 0
GE.EIL..BHZ 2021-05-16T08:25:47.250 2021-05-16T08:28:10.850 0.47 0
GE.EIL..BHZ 2022-03-01T03:14:40.800 2022-03-01T03:16:53.900 0.45 0
Compute scores from randomly selected segments of a given station and channel, but aggregating scores per channel and returning their median:
>>> sdaas "http://geofon.gfz-potsdam.de/fdsnws/station/1/query?net=GE&sta=EIL&cha=BH?&start=2019-01-01" -v -agg median
[██████████████████████████████████████████████████████████]100%  0d 00:00:00
id start end me
Related Skills
claude-opus-4-5-migration
92.1kMigrate prompts and code from Claude Sonnet 4.0, Sonnet 4.5, or Opus 4.1 to Opus 4.5
model-usage
343.3kUse CodexBar CLI local cost usage to summarize per-model usage for Codex or Claude, including the current (most recent) model or a full model breakdown. Trigger when asked for model-level usage/cost data from codexbar, or when you need a scriptable per-model summary from codexbar cost JSON.
TrendRadar
50.3k⭐AI-driven public opinion & trend monitor with multi-platform aggregation, RSS, and smart alerts.🎯 告别信息过载,你的 AI 舆情监控助手与热点筛选工具!聚合多平台热点 + RSS 订阅,支持关键词精准筛选。AI 智能筛选新闻 + AI 翻译 + AI 分析简报直推手机,也支持接入 MCP 架构,赋能 AI 自然语言对话分析、情感洞察与趋势预测等。支持 Docker ,数据本地/云端自持。集成微信/飞书/钉钉/Telegram/邮件/ntfy/bark/slack 等渠道智能推送。
mcp-for-beginners
15.7kThis open-source curriculum introduces the fundamentals of Model Context Protocol (MCP) through real-world, cross-language examples in .NET, Java, TypeScript, JavaScript, Rust and Python. Designed for developers, it focuses on practical techniques for building modular, scalable, and secure AI workflows from session setup to service orchestration.
