UnityHeapExplorer
A Memory Profiler, Debugger and Analyzer for Unity 2019.3 and newer.
Install / Use
/learn @pschraut/UnityHeapExplorerREADME
Introduction
Heap Explorer is a Memory Profiler, Debugger, and Analyzer for Unity 2019 up to Unity 6.
I have spent a significant amount of time in the past identifying and fixing memory leaks, as well as searching for memory optimization opportunities in Unity applications. During this time, I often used Unity's old Memory Profiler. While it's a useful tool, I was never entirely satisfied with it.
This led me to develop my own memory profiler, where I had the opportunity to address all the things I disliked about Unity's Memory Profiler and make them better™.
Fast-forward about a year, Unity Technologies announced that they are also working on a Memory Profiler. This disrupted my plans for Heap Explorer. It was no longer a viable option for me to invest a lot of time in the tool since Unity Technologies' tool is at least as good as what I can come up with.
After much consideration about what to do with Heap Explorer, I concluded that the best option is to provide the source code and move on. You can read more about this here.
Since then, I have provided occasional updates because several people still prefer Heap Explorer over Unity's Memory Profiler due to its easier-to-understand UI/UX.
I do however recommend to install Unity's own Memory Profiler, because I believe it's superior in various ways to Heap Explorer now in the year 2024.
Installation
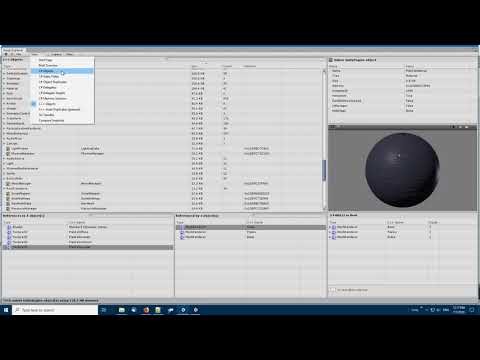
In Unity's Package Manager, choose "Add package from git URL" and insert one of the Package URL's you can find below. Once Heap Explorer is installed, you can open it from Unity's main menu under "Window > Analysis > Heap Explorer".
Package URL's
I recommend to right-click the URL below and choose "Copy Link" rather than selecting the text and copying it, because sometimes it copies a space at the end and the Unity Package Manager can't handle it and spits out an error when you try to add the package.
Please see the CHANGELOG.md file to see what's changed in each version.
| Version | Link | |----------|---------------| | 4.3.0 | https://github.com/pschraut/UnityHeapExplorer.git#4.3.0 | | 4.2.0 | https://github.com/pschraut/UnityHeapExplorer.git#4.2.0 | | 4.1.1 | https://github.com/pschraut/UnityHeapExplorer.git#4.1.1 | | 4.1.0 | https://github.com/pschraut/UnityHeapExplorer.git#4.1.0 | | 4.0.0 | https://github.com/pschraut/UnityHeapExplorer.git#4.0.0 | | 3.9.0 | https://github.com/pschraut/UnityHeapExplorer.git#3.9.0 | | 3.8.0 | https://github.com/pschraut/UnityHeapExplorer.git#3.8.0 | | 3.7.0 | https://github.com/pschraut/UnityHeapExplorer.git#3.7.0 | | 3.6.0 | https://github.com/pschraut/UnityHeapExplorer.git#3.6.0 | | 3.5.0 | https://github.com/pschraut/UnityHeapExplorer.git#3.5.0 | | 3.4.0 | https://github.com/pschraut/UnityHeapExplorer.git#3.4.0 | | 3.3.0 | https://github.com/pschraut/UnityHeapExplorer.git#3.3.0 | | 3.2.0 | https://github.com/pschraut/UnityHeapExplorer.git#3.2.0 |
Credits
If you find this package useful, please mention my name in your credits screen. Something like "Heap Explorer by Peter Schraut" or "Thanks to Peter Schraut" would be very much appreciated.
Contact
The easiest way to get in touch with me, if you already have an Unity forums account, is to post in the Heap Explorer forum thread: https://forum.unity.com/threads/wip-heap-explorer-memory-profiler-debugger-and-analyzer-for-unity.527949/
You could also use the "Start a Conversation" functionality to send me a private message via the Unity forums: https://forum.unity.com/members/peter77.308146/
And last but not least, you can send me an email. Please find the contact information on my website: http://www.console-dev.de
Can I use this tool when I work on a commercial project?
Yes. You can use Heap Explorer to debug, profile and analyze your hobby-, Indie- and commercial applications for free. You do not have to pay me anything.
If you find Heap Explorer useful, please mention my name in your credits screen. Something like "Heap Explorer by Peter Schraut" or "Thanks to Peter Schraut" would be very much appreciated.
How to capture a memory snapshot
Heap Explorer displays the connected Player in the "Capture" drop-down, which you can find in the toolbar. The button is located under a drop-down menu, to avoid clicking it by accident. If no Player is connected, Heap Explorer displays "Editor". Clicking the "Editor" button then captures a memory snapshot of the Unity editor.

If a Player is connected, Heap Explorer displays the Player name, rather than "Editor". It's the same name that appears in Unity's Profiler window as well.
| Item | Description | |----------|---------------| | Capture and Save | Prompts for a save location before the memory snapshot is captured. This feature has been added to allow you to quickly capture a memory snapshot that you can analyze later, without Heap Explorer analyzing the snapshot, which can be an expensive operation. | | Capture and Analyze | Captures a memory snapshot and immediately analyzes it. | | Open Profiler | Opens Unity's Profiler window. In order to connect to a certain target, you have to use Unity's Profiler. As you select a different target (Editor, WindowsPlayer, ...) in Unity's Profiler window, Heap Explorer will update its entry in the "Capture" drop-down accordingly, depending on what is selected in Unity's Profiler. |
Brief Overview
The Brief Overview page shows the most important "quick info" in a simple to read fashion, such as the top 20 object types that consume the most memory.

Compare Memory Snapshots
Heap Explorer supports to compare two memory snapshots and show the difference between those. This is an useful tool to find memory leaks.

"A" and "B" represent two different memory snapshots.
The "delta" columns indicate changes. The "C# Objects" and "C++ Objects" nodes can be expanded to see which objects specifically cause the difference.
Snapshot "A" is always the one you loaded using "File > Open Snapshot" or captured. While "B" is the memory snapshot that is used for comparison and can be replaced using the "Load..." button in the Compare Snapshot view.
C# Objects
The C# Objects view displays managed objects found in a memory snapshot. Object instances are grouped by type. Grouping object instances by type allows to see how much memory a certain type is using.

| Location | Description | |----------|---------------| | Top-left panel | The main list that shows all managed objects found in the snapshot. | | Top-right panel | An Inspector that displays fields and their corresponding values of the selected object. | | Bottom-right panel | One or multiple paths to root of the selected object. | | Bottom-left panel | Objects that hold a reference to the selected object. |
You can left-click on a column to sort and right-click on a column header to toggle individual columns:
| Column | Description | |----------|---------------| | C# Type | The managed type of the object instance, such as System.String. | | C++ Name | If the C# object has a C++ counter-part, basically C# types that derive from UnityEngine.Object have, the name of the C++ native object is displayed in this column (UnityEngine.Object.name). | | Size | The amount of memory a managed object or group of managed objects is using. | | Count | The number of managed objects in a group. | | Address | The memory address of a managed object. | | Assembly | The assembly (DLL) name in which the type lives. |
C# Object Inspector
The C# Object Inspector displays fields of a managed object, along with the field type and value. I tried to mimic the feel of Visual Studio's Watch window.

The arrow in-front of the Name indicates the field provides further fields itself, or in the case of an array, provides array elements. Click the arrow to expand, as shown below.

The icon in-front of the Name represents the "high-level type" of a field, such as: ReferenceType, ValueType, Enum and Delegate. If the field is a ReferenceType, a button is shown next to the Name, which can be used to jump to the object instance.

A magnification icon appears next to the value, if the type provides a specific "Data Visualizer". A data visualizer allows Heap Explorer to display the value in a more specific way, tailored to the type, as shown below.

If a field is a pointer-type (ReferenceType, IntPtr, UIntPtr), but it points to null, the field is grayed-out. I found this very useful, because you often ignore null-values and having those grayed-out, makes it easier to skip them mentally.

The eye-like icon in the top-right corner of the Inspector can be used to toggle between the field- and raw-memory mode. I don't know how useful the raw-memory mode is for you, but it helped me to understand object memory, field layouts, etc while I was developing Heap Explorer. I thought there is no need to remove it.

References / Referenced by
Th
Related Skills
node-connect
335.2kDiagnose OpenClaw node connection and pairing failures for Android, iOS, and macOS companion apps
frontend-design
82.5kCreate distinctive, production-grade frontend interfaces with high design quality. Use this skill when the user asks to build web components, pages, or applications. Generates creative, polished code that avoids generic AI aesthetics.
openai-whisper-api
335.2kTranscribe audio via OpenAI Audio Transcriptions API (Whisper).
commit-push-pr
82.5kCommit, push, and open a PR
