Plotters
A rust drawing library for high quality data plotting for both WASM and native, statically and realtimely 🦀 📈🚀
Install / Use
/learn @plotters-rs/PlottersREADME
Plotters - A Rust drawing library focusing on data plotting for both WASM and native applications 🦀📈🚀
<a href="https://crates.io/crates/plotters"> <img style="display: inline!important" src="https://img.shields.io/crates/v/plotters.svg"></img> </a> <a href="https://docs.rs/plotters"> <img style="display: inline!important" src="https://docs.rs/plotters/badge.svg"></img> </a> <a href="https://docs.rs/plotters"> <img style="display: inline!important" src="https://img.shields.io/crates/d/plotters"></img> </a> <a href="https://plotters-rs.github.io/rustdoc/plotters/"> <img style="display: inline! important" src="https://img.shields.io/badge/docs-development-lightgrey.svg"></img> </a>Plotters is a drawing library designed for rendering figures, plots, and charts, in pure Rust. Plotters supports various types of back-ends, including bitmap, vector graph, piston window, GTK/Cairo and WebAssembly.
- A new Plotters Developer's Guide is a work in progress. The preview version is available here.
- Try Plotters with an interactive Jupyter notebook, or view here for the static HTML version.
- To view the WASM example, go to this link
- Currently we have all the internal code ready for console plotting, but a console based backend is still not ready. See this example for how to plot on console with a customized backend.
- Plotters has moved some backend code to separate repositories, check FAQ list for details
- Some interesting demo projects are available, feel free to try them out.
Gallery
To view the source code for each example, please click on the example image.
<a href="https://github.com/plotters-rs/plotters/blob/master/plotters/examples/chart.rs"> <img src="https://plotters-rs.github.io/plotters-doc-data/sample.png" class="galleryItem" width=200px></img> </a> <a href="https://github.com/plotters-rs/plotters/blob/master/plotters/examples/stock.rs"> <img src="https://plotters-rs.github.io/plotters-doc-data/stock.png" class="galleryItem" width=200px></img> </a> <a href="https://github.com/plotters-rs/plotters/blob/master/plotters/examples/histogram.rs"> <img src="https://plotters-rs.github.io/plotters-doc-data/histogram.png" class="galleryItem" width=200px></img> </a> <a href="https://github.com/plotters-rs/plotters#quick-start"> <img src="https://plotters-rs.github.io/plotters-doc-data/0.png" class="galleryItem" width=200px></img> </a> <a href="#"> <img src="https://plotters-rs.github.io/plotters-doc-data/console-2.png" class="galleryItem" width=200px></img> </a> <a href="https://github.com/plotters-rs/plotters/blob/master/plotters/examples/mandelbrot.rs"> <img src="https://plotters-rs.github.io/plotters-doc-data/mandelbrot.png" class="galleryItem" width=200px></img> </a> <a href="https://github.com/plotters-rs/plotters#trying-with-jupyter-evcxr-kernel-interactively"> <img src="https://plotters-rs.github.io/plotters-doc-data/evcxr_animation.gif" class="galleryItem" width=200px></img> </a> <a href="https://github.com/plotters-rs/plotters-piston/blob/master/examples/cpustat.rs"> <img src="https://plotters-rs.github.io/plotters-doc-data/plotters-piston.gif" class="galleryItem" width=200px></img> </a> <a href="https://github.com/plotters-rs/plotters/blob/master/plotters/examples/normal-dist.rs"> <img src="https://plotters-rs.github.io/plotters-doc-data/normal-dist.png" class="galleryItem" width=200px></img> </a> <a href="https://github.com/plotters-rs/plotters/blob/master/plotters/examples/two-scales.rs"> <img src="https://plotters-rs.github.io/plotters-doc-data/twoscale.png" class="galleryItem" width=200px></img> </a> <a href="https://github.com/plotters-rs/plotters/blob/master/plotters/examples/matshow.rs"> <img src="https://plotters-rs.github.io/plotters-doc-data/matshow.png" class="galleryItem" width=200px></img> </a> <a href="https://github.com/plotters-rs/plotters/blob/master/plotters/examples/sierpinski.rs"> <img src="https://plotters-rs.github.io/plotters-doc-data/sierpinski.png" class="galleryItem" width=200px></img> </a> <a href="https://github.com/plotters-rs/plotters/blob/master/plotters/examples/normal-dist2.rs"> <img src="https://plotters-rs.github.io/plotters-doc-data/normal-dist2.png" class="galleryItem" width=200px></img> </a> <a href="https://github.com/plotters-rs/plotters/blob/master/plotters/examples/errorbar.rs"> <img src="https://plotters-rs.github.io/plotters-doc-data/errorbar.png" class="galleryItem" width=200px></img> </a> <a href="https://github.com/plotters-rs/plotters/blob/master/plotters/examples/slc-temp.rs"> <img src="https://plotters-rs.github.io/plotters-doc-data/slc-temp.png" class="galleryItem" width=200px></img> </a> <a href="https://github.com/plotters-rs/plotters/blob/master/plotters/examples/area-chart.rs"> <img src="https://plotters-rs.github.io/plotters-doc-data/area-chart.png" class="galleryItem" width=200px></img> </a> <a href="https://github.com/plotters-rs/plotters/blob/master/plotters/examples/snowflake.rs"> <img src="https://plotters-rs.github.io/plotters-doc-data/snowflake.png" class="galleryItem" width=200px></img> </a> <a href="https://github.com/plotters-rs/plotters/blob/master/plotters/examples/animation.rs"> <img src="https://plotters-rs.github.io/plotters-doc-data/animation.gif" class="galleryItem" width=200px></img> </a> <a href="https://github.com/plotters-rs/plotters/blob/master/plotters/examples/console.rs"> <img src="https://plotters-rs.github.io/plotters-doc-data/console-example.png" class="galleryItem" width=200px></img> </a> <a href="https://github.com/plotters-rs/plotters/blob/master/plotters/examples/console.rs"> <img src="https://plotters-rs.github.io/plotters-doc-data/console.png" class="galleryItem" width=200px></img> </a> <a href="https://github.com/plotters-rs/plotters/blob/master/plotters/examples/blit-bitmap.rs"> <img src="https://plotters-rs.github.io/plotters-doc-data/blit-bitmap.png" class="galleryItem" width=200px></img> </a> <a href="https://github.com/plotters-rs/plotters/blob/master/plotters/examples/boxplot.rs"> <img src="https://plotters-rs.github.io/plotters-doc-data/boxplot.svg" class="galleryItem" width=200px></img> </a> <a href="https://github.com/plotters-rs/plotters/blob/master/plotters/examples/3d-plot.rs"> <img src="https://plotters-rs.github.io/plotters-doc-data/3d-plot.svg" class="galleryItem" width=200px></img> </a> <a href="https://github.com/plotters-rs/plotters/blob/master/plotters/examples/3d-plot2.rs"> <img src="https://plotters-rs.github.io/plotters-doc-data/3d-plot2.gif" class="galleryItem" width=200px></img> </a> <a href="https://github.com/plotters-rs/plotters/blob/master/plotters/examples/tick_control.rs"> <img src="https://plotters-rs.github.io/plotters-doc-data/tick_control.svg" class="galleryItem" width=200px></img> </a>Table of Contents
- Gallery
- Dependencies
- Quick Start
- Demo Projects
- Trying with Jupyter evcxr Kernel Interactively
- Interactive Tutorial with Jupyter Notebook
- Plotting in Rust
- Plotting on HTML5 canvas with WASM Backend
- What types of figure are supported?
- Concepts by example
- Misc
- FAQ List
Dependencies
Ubuntu Linux
sudo apt install pkg-config libfreetype6-dev libfontconfig1-dev
Fedora Linux
sudo dnf install pkgconf freetype-devel fontconfig-devel
Quick Start
To use Plotters, you can simply add Plotters into your Cargo.toml
[dependencies]
plotters = "0.3.3"
Create the subdirectory <Cargo project dir>/plotters-doc-data
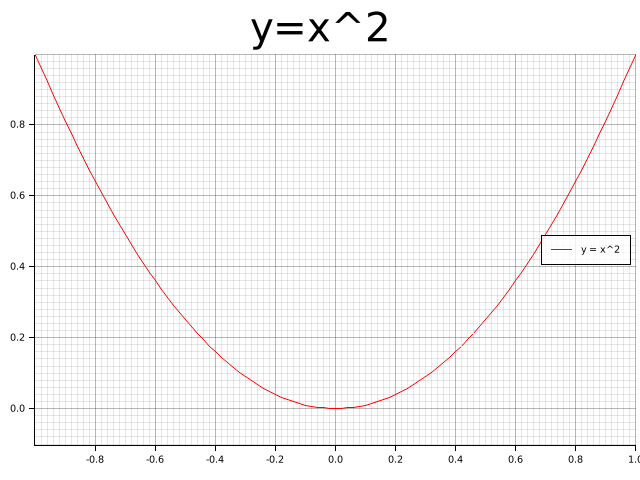
And the following code draws a quadratic function. src/main.rs writes the chart to plotters-doc-data/0.png
use plotters::prelude::*;
fn main() -> Result<(), Box<dyn std::error::Error>> {
    let root = BitMapBackend::new("plotters-doc-data/0.png", (640, 480)).into_drawing_area();
    root.fill(&WHITE)?;
    let mut chart = ChartBuilder::on(&root)
        .caption("y=x^2", ("sans-serif", 50).into_font())
        .margin(5)
        .x_label_area_size(30)
        .y_label_area_size(30)
        .build_cartesian_2d(-1f32..1f32, -0.1f32..1f32)?;

    chart.configure_mesh().draw()?;

    chart
        .draw_series(LineSeries::new(
            (-50..=50).map(|x| x as f32 / 50.0).map(|x| (x, x * x)),
            &RED,
        ))?
        .label("y = x^2")
        .legend(|(x, y)| PathElement::new(vec![(x, y), (x + 20, y)], &RED));

    chart
        .configure_series_labels()
        .background_style(&WHITE.mix(0.8))
        .border_style(&BLACK)
        .draw()?;

    root.present()?;

    Ok(())
}
Demo Projects
To learn how to use Plotters in different scenarios, check out the following demo projects:
- WebAssembly + Plotters: plotters-wasm-demo
- minifb + Plotters: [plotters-minifb-demo](https://github.com/plotters-rs/plotters-mi
