Scalene
Scalene: a high-performance, high-precision CPU, GPU, and memory profiler for Python with AI-powered optimization proposals
Install / Use
/learn @plasma-umass/ScaleneREADME
![]()
Scalene: a Python CPU+GPU+memory profiler with AI-powered optimization proposals
by Emery Berger, Sam Stern, and Juan Altmayer Pizzorno.


(tweet from Ian Ozsvald, author of High Performance Python)

Python Profiler Links to AI to Improve Code Scalene identifies inefficiencies and asks GPT-4 for suggestions, IEEE Spectrum
Episode 172: Measuring Multiple Facets of Python Performance With Scalene, The Real Python podcast
Scalene web-based user interface: https://scalene-gui.github.io/scalene-gui/
About Scalene
Scalene is a high-performance CPU, GPU and memory profiler for Python that does a number of things that other Python profilers do not and cannot do. It runs orders of magnitude faster than many other profilers while delivering far more detailed information. It is also the first profiler ever to incorporate AI-powered proposed optimizations.
AI-powered optimization suggestions
Note
For optimization suggestions, Scalene supports a variety of AI providers, including Amazon Bedrock, Microsoft Azure, OpenAI, and local models via Ollama. To enable AI-powered optimization suggestions from AI providers, you need to select a provider and, if needed, enter your credentials, in the box under "AI Optimization Options".
<img width="607" height="316" alt="AI Optimization Options" src="https://github.com/user-attachments/assets/3c803237-063f-481a-8624-5c1d7f205c8a" />
Once you've entered your key and any other needed data, click on the lightning bolt (⚡) beside any line or the explosion (💥) for an entire region of code to generate a proposed optimization. Click on a proposed optimization to copy it to the clipboard.
<img width="571" alt="example proposed optimization" src="https://user-images.githubusercontent.com/1612723/211639968-37cf793f-3290-43d1-9282-79e579558388.png">You can click as many times as you like on the lightning bolt or explosion, and it will generate different suggested optimizations. Your mileage may vary, but in some cases, the suggestions are quite impressive (e.g., order-of-magnitude improvements).
Quick Start
Installing Scalene:
python3 -m pip install -U scalene
or
conda install -c conda-forge scalene
Using Scalene:
After installing Scalene, you can use Scalene at the command line, or as a Visual Studio Code extension.
<details> <summary> Using the Scalene VS Code Extension: </summary>First, install <a href="https://marketplace.visualstudio.com/items?itemName=EmeryBerger.scalene">the Scalene extension from the VS Code Marketplace</a> or by searching for it within VS Code by typing Command-Shift-X (Mac) or Ctrl-Shift-X (Windows). Once that's installed, click Command-Shift-P or Ctrl-Shift-P to open the <a href="https://code.visualstudio.com/docs/getstarted/userinterface">Command Palette</a>. Then select <b>"Scalene: AI-powered profiling..."</b> (you can start typing Scalene and it will pop up if it's installed). Run that and, assuming your code runs for at least a second, a Scalene profile will appear in a webview.
<img width="734" alt="Screenshot 2023-09-20 at 7 09 06 PM" src="https://github.com/plasma-umass/scalene/assets/1612723/7e78e3d2-e649-4f02-86fd-0da2a259a1a4"> </details> <details> <summary> Commonly used command-line options: </summary>Scalene uses a verb-based command structure with two main commands: run (to profile) and view (to display results).
# Profile a program (saves to scalene-profile.json)
scalene run your_prog.py
python3 -m scalene run your_prog.py              # equivalent alternative

# View a profile
scalene view                                     # open profile in browser
scalene view --cli                               # view in terminal
scalene view --html                              # save to scalene-profile.html
scalene view --standalone                        # save as self-contained HTML

# Common profiling options
scalene run --cpu-only your_prog.py              # only profile CPU (faster)
scalene run -o results.json your_prog.py         # custom output filename
scalene run -c config.yaml your_prog.py          # load options from config file

# Pass arguments to your program (use --- separator)
scalene run your_prog.py --- --arg1 --arg2

# Get help
scalene --help                                   # main help
scalene run --help                               # profiling options
scalene run --help-advanced                      # advanced profiling options
scalene view --help                              # viewing options
You can store Scalene options in a YAML configuration file and load them with -c or --config:
scalene run -c scalene.yaml your_prog.py
Example scalene.yaml:
# Output options
outfile: my-profile.json

# Profiling mode (use only one)
cpu-only: true              # CPU profiling only (faster)
# gpu: true                 # Include GPU profiling
# memory: true              # Include memory profiling

# Filter what gets profiled
profile-only: "mypackage,mymodule"    # Only profile these paths
profile-exclude: "tests,venv"          # Exclude these paths
profile-all: false                     # Profile all code, not just target

# Performance tuning
cpu-percent-threshold: 1     # Min CPU% to report (default: 1)
cpu-sampling-rate: 0.01      # Sampling interval in seconds
malloc-threshold: 100        # Min allocations to report

# Other options
use-virtual-time: false      # Measure CPU time only (not I/O)
stacks: false                # Collect stack traces
memory-leak-detector: true   # Detect likely memory leaks
Command-line arguments override config file settings.
</details> <details> <summary> Using Scalene programmatically in your code: </summary>Invoke using scalene as above and then:
from scalene import scalene_profiler

# Turn profiling on
scalene_profiler.start()

# your code

# Turn profiling off
scalene_profiler.stop()
from scalene.scalene_profiler import enable_profiling

with enable_profiling():
    # do something
Just preface any functions you want to profile with the @profile decorator and run it with Scalene:
# do not import profile!

@profile
def slow_function():
    import time
    time.sleep(3)
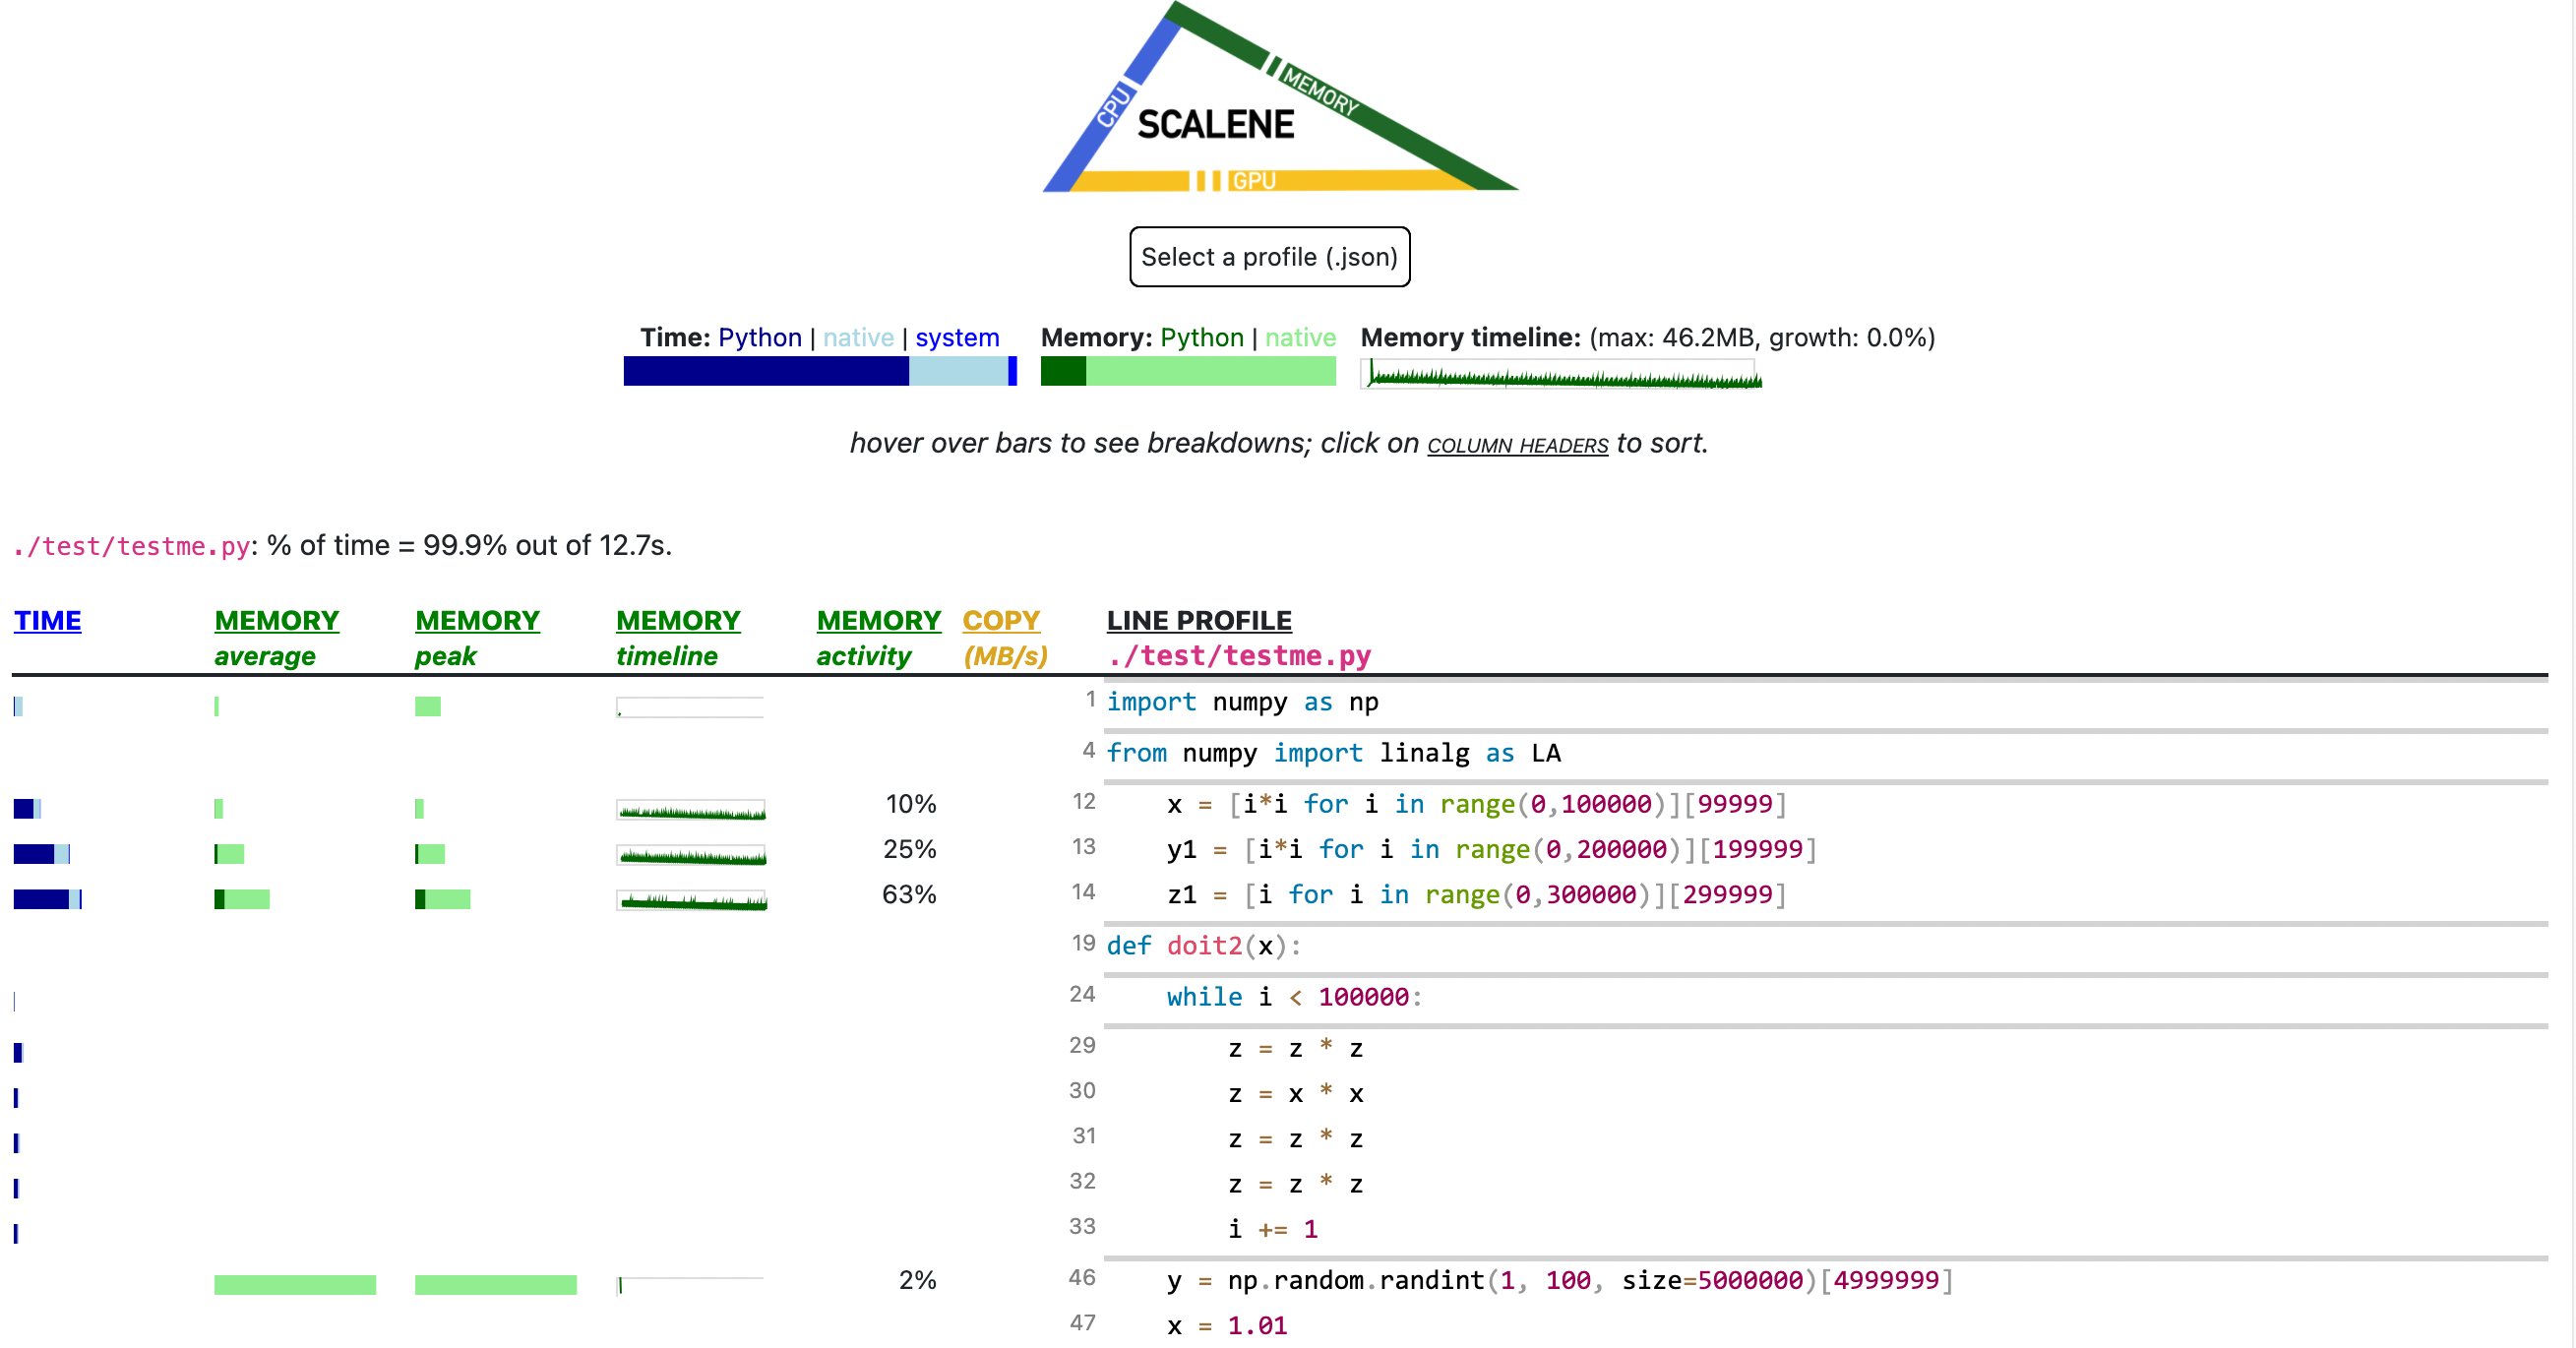
Web-based GUI
Scalene has both a CLI and a web-based GUI (demo here).
By default, once Scalene has profiled your program, it will open a tab in a web browser with an interactive user interface (all processing is done locally). Hover over bars to see breakdowns of CPU and memory consumption, and click on underlined column headers to sort the columns. The GUI works fully offline with no internet connection required.
Use scalene view --standalone to generate a completely self-contained HTML file with all assets embedded, perfect for sharing or archiving.
Scalene Overview
Scalene talk (PyCon US 2021)
This talk presented at PyCon 2021 walks through Scalene's advantages and how to use it to debug the performance of an application (and provides some technical details on its internals). We highly recommend watching this video!
[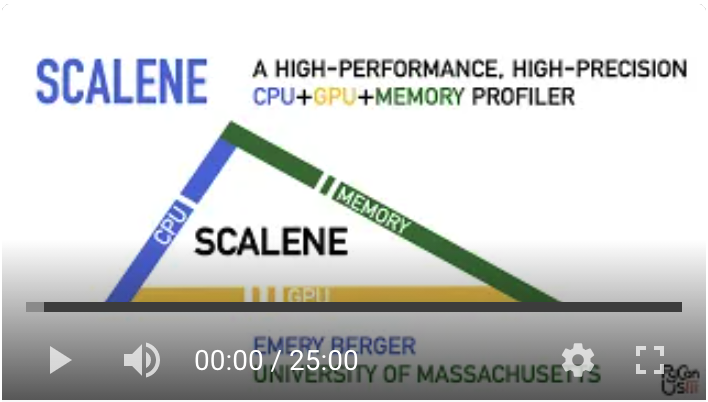 ](https://youtu.be/5iEf-_7mM1k "Scalene presentation at PyCon 202
