TAcharts
Apply popular TA tools and charts to candlestick data with NumPy.
Install / Use
/learn @pegahcarter/TAchartsREADME
TAcharts 0.0.30
By: Carter Carlson
Contributors: @juanfrcaliz, @rnarciso, @t3ch9
This repository provides technical tools to analyze OHLCV data, along with several TA chart functionalities. These functions are optimized for speed and utilize numpy vectorization over built-in pandas methods when possible.
Methods
Indicators With Chart Functionality
Bollinger(df=None, filename=None, interval=None, n=20, ndev=2): Bollinger BandsIchimoku(df=None, filename=None, interval=None): Ichimoku CloudRenko(df=None, filename=None, interval=None): Renko Chart
Indicators Without Chart Functionality
atr(high, low, close, n=2): average true range from candlestick datacmf(df, n=2): Chaikin Money Flow of an OHLCV datasetdouble_smooth(src, n_slow, n_fast): The smoothed value of two EMAsema(src, n=2): exponential moving average for a list ofsrcacrossnperiodsmacd(src, slow=25, fast=13): moving average convergence/divergence ofsrcmmo(src, n=2): Murrey Math oscillator ofsrcroc(src, n=2): rate of change ofsrcacrossnperiodsrolling(src, n=2, fn=None, axis=1): rollingsum,max,min,mean, ormedianofsrcacrossnperiodsrsi(src, n=2): relative strength index ofsrcacrossnperiodssdev(src, n=2): standard deviation across n periodssma(src, n=2): simple moving average ofsrcacrossnperiodstd_sequential(src, n=2): TD sequential ofsrcacrossnperiodstsi(src, slow=25, fast=13): true strength indicator
utils
area_between(line1, line2): find the area between line1 and line2crossover(x1, x2): find all instances of intersections between two linesdraw_candlesticks(ax, df): add candlestick visuals to a matplotlib chartfill_values(averages, interval, target_len): Fill missing values with evenly spaced samples.- Example: You're using 15-min candlestick data to find the 1-hour moving average and want a value at every 15-min mark, and not every 1-hour mark.
group_candles(df, interval=4): combine candles so instead of needing a different dataset for each time interval, you can form time intervals using more precise data.- Example: you have 15-min candlestick data but want to test a strategy based
on 1-hour candlestick data (
interval=4).
- Example: you have 15-min candlestick data but want to test a strategy based
on 1-hour candlestick data (
intersection(a0, a1, b0, b1): find the intersection coordinates between vector A and vector B
How it works
Create your DataFrame
# NOTE: we are using 1-hour BTC OHLCV data from 2019.01.01 00:00:00 to 2019.12.31 23:00:00
from TAcharts.utils.ohlcv import OHLCV

df = OHLCV().btc

df.head()
| date | open | high | low | close | volume
--------|-------|------|-------|------|-------|--------
0 | 2019-01-01 00:00:00 | 3699.95 | 3713.93 | 3697.00 | 3703.56 | 660.279771
1 | 2019-01-01 01:00:00 | 3703.63 | 3726.64 | 3703.34 | 3713.83 | 823.625491
2 | 2019-01-01 02:00:00 | 3714.19 | 3731.19 | 3707.00 | 3716.70 | 887.101362
3 | 2019-01-01 03:00:00 | 3716.98 | 3732.00 | 3696.14 | 3699.95 | 955.879034
4 | 2019-01-01 04:00:00 | 3699.96 | 3717.11 | 3698.00 | 3713.07 | 534.113945
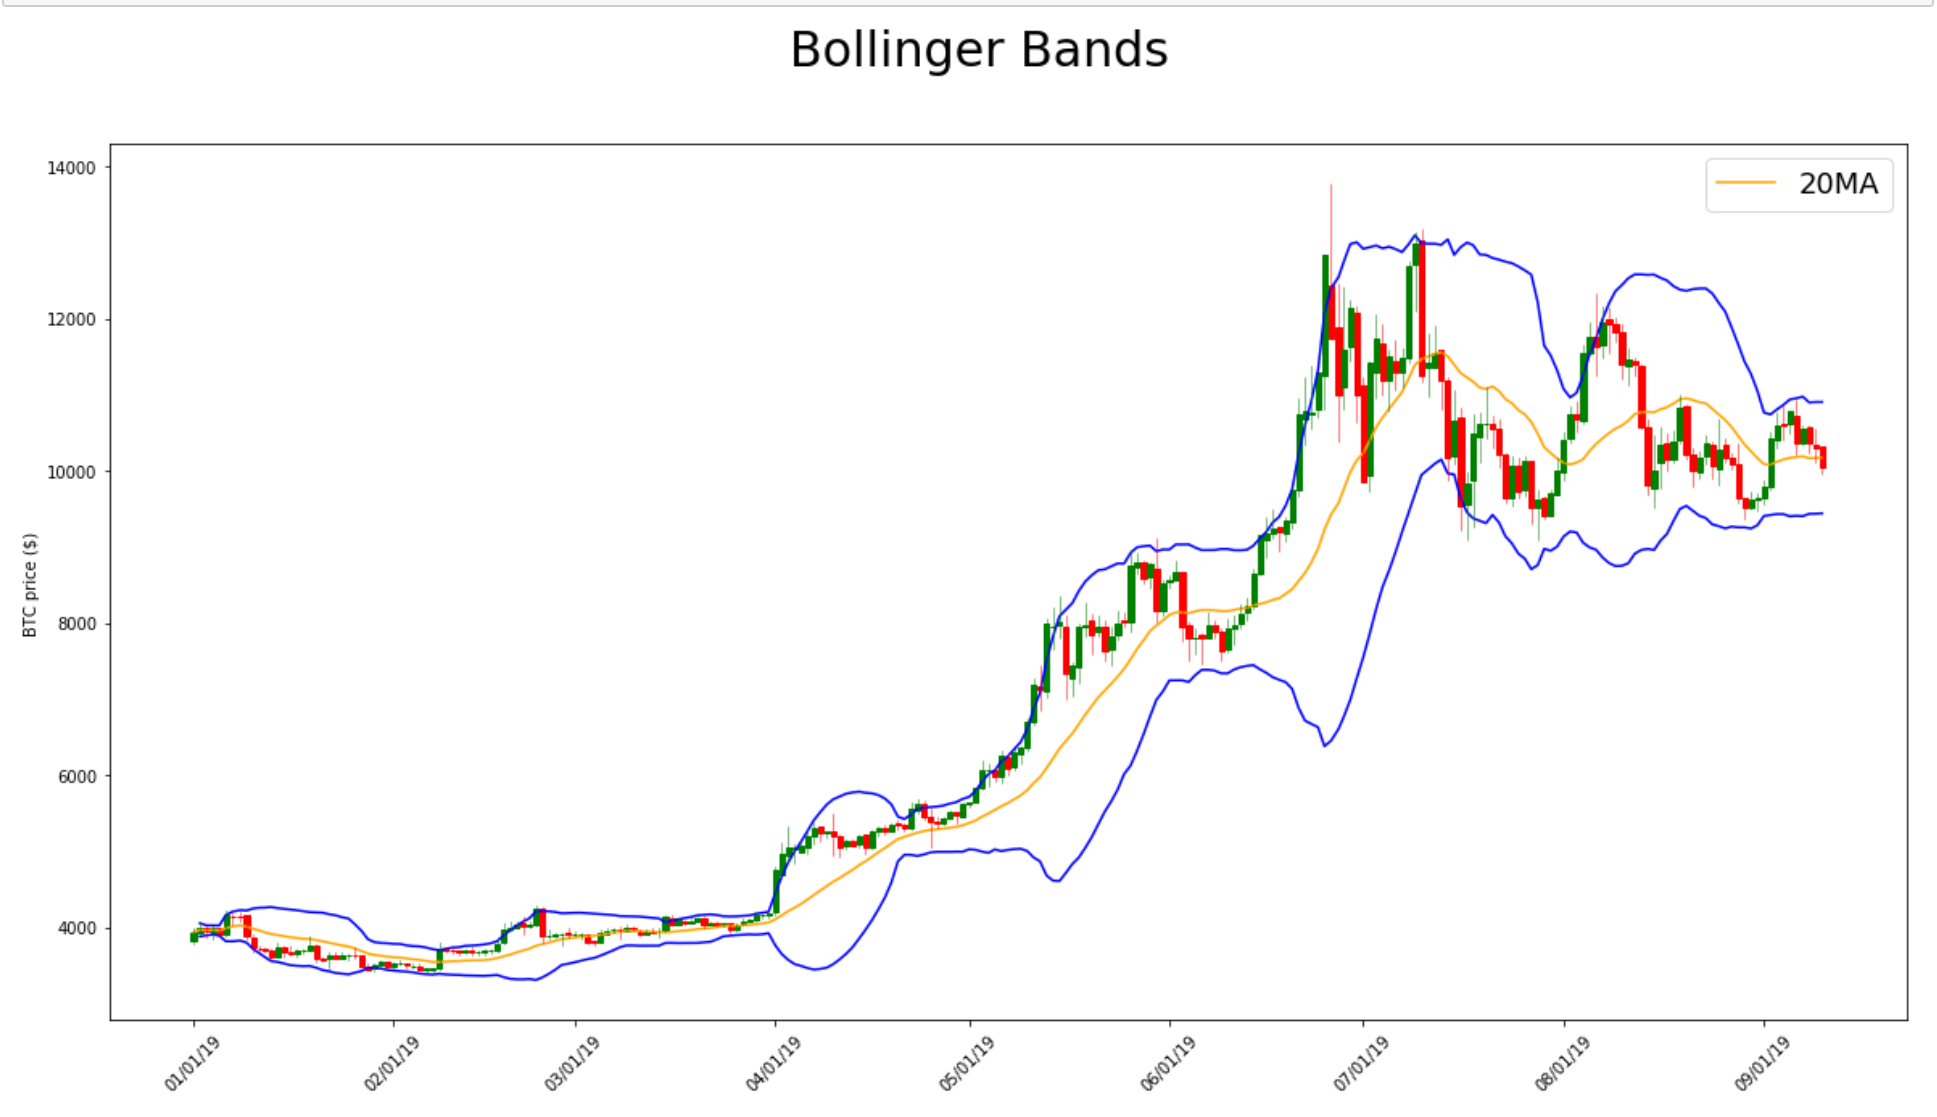
Bollinger Bands
from TAcharts.indicators.bollinger import Bollinger

b = Bollinger(df)
b.build(n=20, ndev=2)

b.plot()
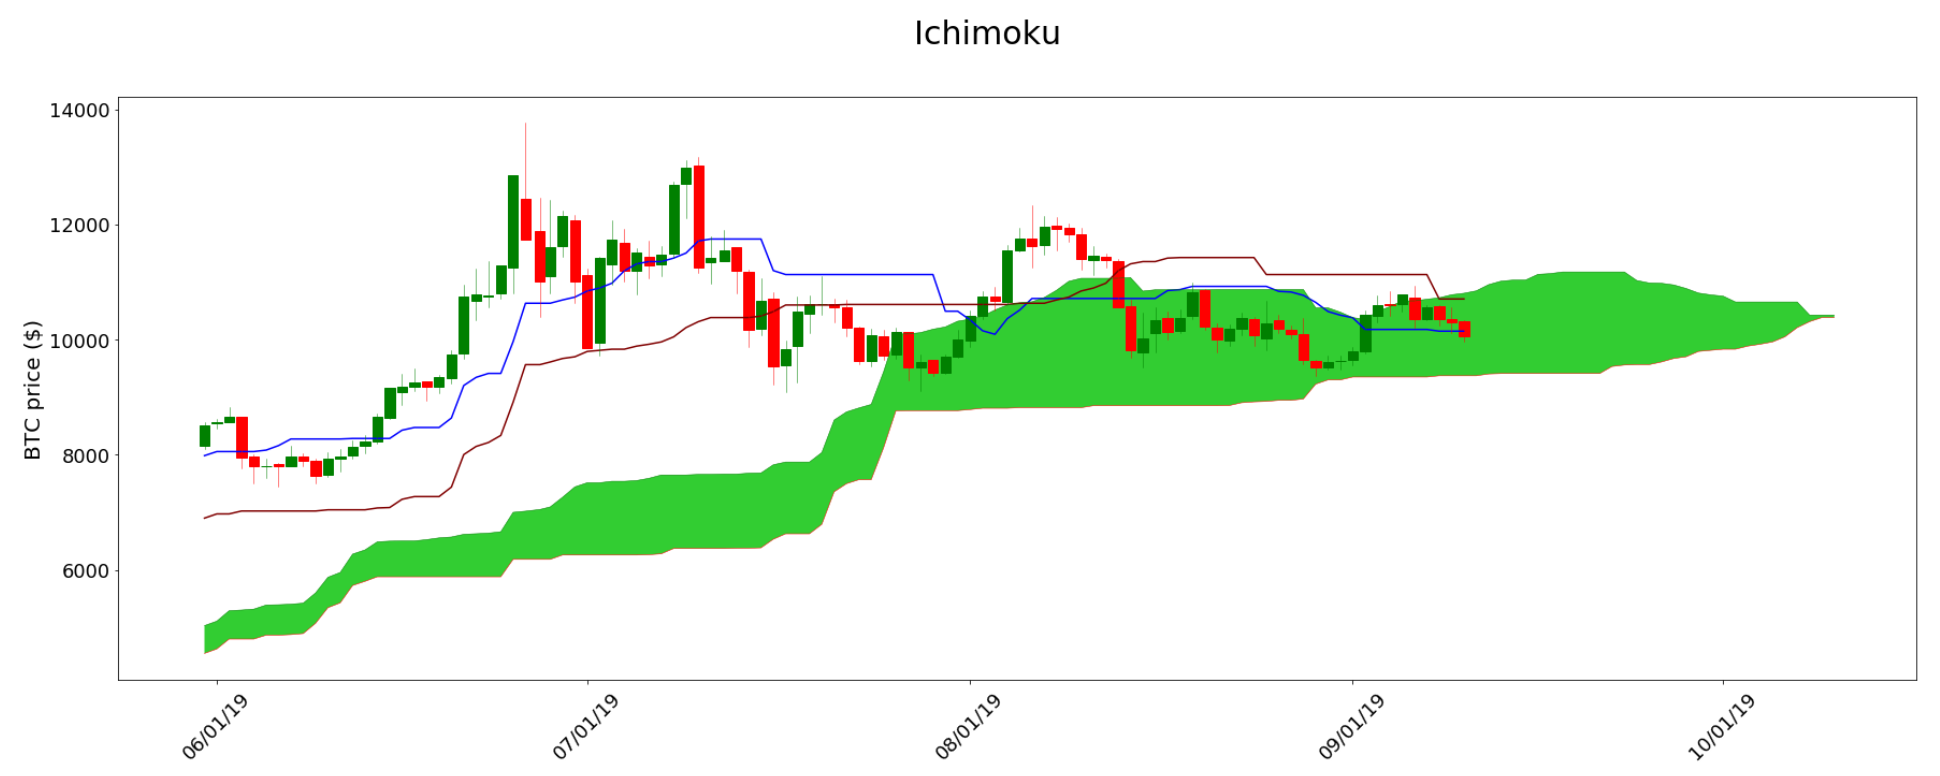
Ichimoku
from TAcharts.indicators.ichimoku import Ichimoku

i = Ichimoku(df)
i.build(20, 60, 120, 30)

i.plot()
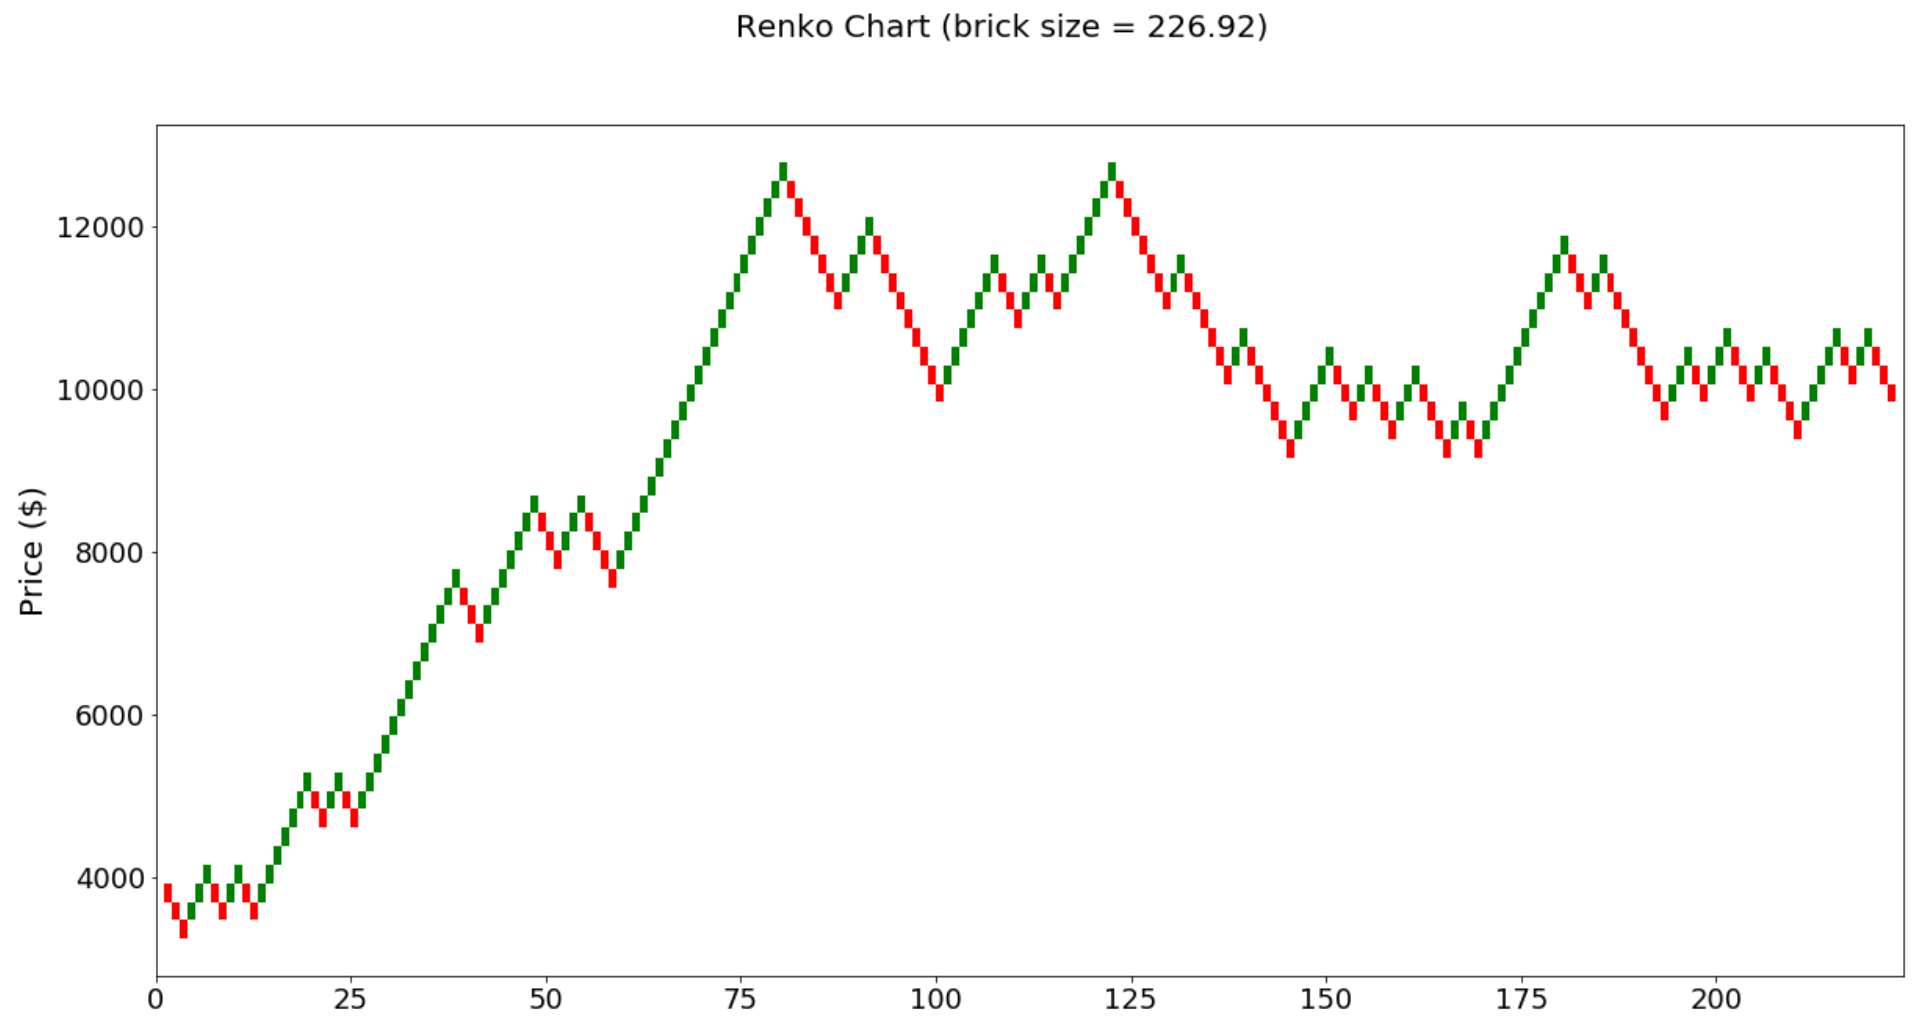
Renko
from TAcharts.indicators.renko import Renko

r = Renko(df)
r.set_brick_size(auto=True, atr_interval=2)
r.build()

r.plot()
wrappers
-
@args_to_dtype(dtype): Convert all function arguments to a specific data typefrom TAcharts.wrappers import args_to_dtype # Example: `src` is converted to a list @args_to_dtype(list) def rsi(src, n=2): pass -
@pd_series_to_np_array: Convert function arguments frompd.Seriestonp.arrayusingpd.Series.values. This wrapper is 10x quicker than using@args_to_dtype(np.array)when working with Pandas series.from TAcharts.wrappers import pd_series_to_np_array # Example: `high`, `low`, and `close` are all converted into `np.array` data types @pd_series_to_np_array def atr(high, low, close, n=14): pass
Related Skills
node-connect
339.1kDiagnose OpenClaw node connection and pairing failures for Android, iOS, and macOS companion apps
claude-opus-4-5-migration
83.8kMigrate prompts and code from Claude Sonnet 4.0, Sonnet 4.5, or Opus 4.1 to Opus 4.5
frontend-design
83.8kCreate distinctive, production-grade frontend interfaces with high design quality. Use this skill when the user asks to build web components, pages, or applications. Generates creative, polished code that avoids generic AI aesthetics.
model-usage
339.1kUse CodexBar CLI local cost usage to summarize per-model usage for Codex or Claude, including the current (most recent) model or a full model breakdown. Trigger when asked for model-level usage/cost data from codexbar, or when you need a scriptable per-model summary from codexbar cost JSON.
