Termplotlib
:chart_with_upwards_trend: Plotting on the command line
Install / Use
/learn @nschloe/TermplotlibREADME
termplotlib


![]()
termplotlib is a Python library for all your terminal plotting needs. It aims to work like matplotlib.
Line plots
For line plots, termplotlib relies on gnuplot. With that installed, the code
import termplotlib as tpl
import numpy as np

x = np.linspace(0, 2 * np.pi, 10)
y = np.sin(x)

fig = tpl.figure()
fig.plot(x, y, label="data", width=50, height=15)
fig.show()
produces
<!--pytest-codeblocks:expected-output--> 1 +---------------------------------------+
0.8 | ** ** |
0.6 | * ** data ******* |
0.4 | ** |
0.2 |* ** |
0 | ** |
| * |
-0.2 | ** ** |
-0.4 | ** * |
-0.6 | ** |
-0.8 | **** ** |
-1 +---------------------------------------+
0 1 2 3 4 5 6 7
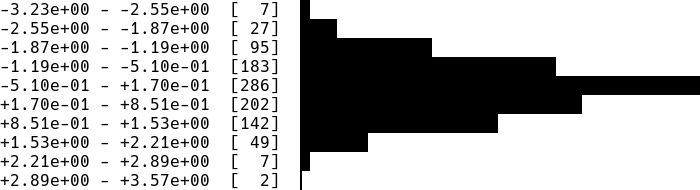
Horizontal histograms
import termplotlib as tpl
import numpy as np

rng = np.random.default_rng(123)
sample = rng.standard_normal(size=1000)
counts, bin_edges = np.histogram(sample)

fig = tpl.figure()
fig.hist(counts, bin_edges, orientation="horizontal", force_ascii=False)
fig.show()
produces
Horizontal bar charts are covered as well. This
import termplotlib as tpl

fig = tpl.figure()
fig.barh([3, 10, 5, 2], ["Cats", "Dogs", "Cows", "Geese"], force_ascii=True)
fig.show()
produces
<!--pytest-codeblocks:expected-output-->Cats [ 3] ************
Dogs [10] ****************************************
Cows [ 5] ********************
Geese [ 2] ********
Vertical histograms
import termplotlib as tpl
import numpy as np

rng = np.random.default_rng(123)
sample = rng.standard_normal(size=1000)
counts, bin_edges = np.histogram(sample, bins=40)
fig = tpl.figure()
fig.hist(counts, bin_edges, grid=[15, 25], force_ascii=False)
fig.show()
produces

Tables
Support for tables has moved over to termtables.
Installation
termplotlib is available from the Python Package Index, so simply do
pip install termplotlib
to install.
Testing
To run the termplotlib unit tests, check out this repository and type
pytest
Similar projects
Related Skills
node-connect
346.4kDiagnose OpenClaw node connection and pairing failures for Android, iOS, and macOS companion apps
claude-opus-4-5-migration
107.2kMigrate prompts and code from Claude Sonnet 4.0, Sonnet 4.5, or Opus 4.1 to Opus 4.5
frontend-design
107.2kCreate distinctive, production-grade frontend interfaces with high design quality. Use this skill when the user asks to build web components, pages, or applications. Generates creative, polished code that avoids generic AI aesthetics.
model-usage
346.4kUse CodexBar CLI local cost usage to summarize per-model usage for Codex or Claude, including the current (most recent) model or a full model breakdown. Trigger when asked for model-level usage/cost data from codexbar, or when you need a scriptable per-model summary from codexbar cost JSON.
