Tui.chart
🍞📊 Beautiful chart for data visualization.
Install / Use
/learn @nhn/Tui.chartREADME

🍞📈 Spread your data on TOAST UI Chart. TOAST UI Chart is Beautiful Statistical Data Visualization library.


![]()
![]()
![]()
📦 Packages
The functionality of TOAST UI Chart is available when using the Plain JavaScript, React, Vue Component.
- toast-ui.chart - Plain JavaScript component implemented by NHN Cloud.
- toast-ui.vue-chart - Vue wrapper component implemented by NHN Cloud.
- toast-ui.react-chart - React wrapper component implemented by NHN Cloud.
📙 Documents
😍 Why TOAST UI Chart?
Simple, Easy to Use, And It's Beautiful!
TOAST UI Chart makes your data pop and presents it in a manner that is easy to understand. Furthermore, it provides a wide range of theme options for customizing the charts to be suitable for all of your services. Chart components like the title, axes, legends, tooltips, plots, series, and more can be customized through the options.

Variety of powerful features!
Responsive
Add different options and animations according to the charts' sizes by using the responsive option.

Zoomable
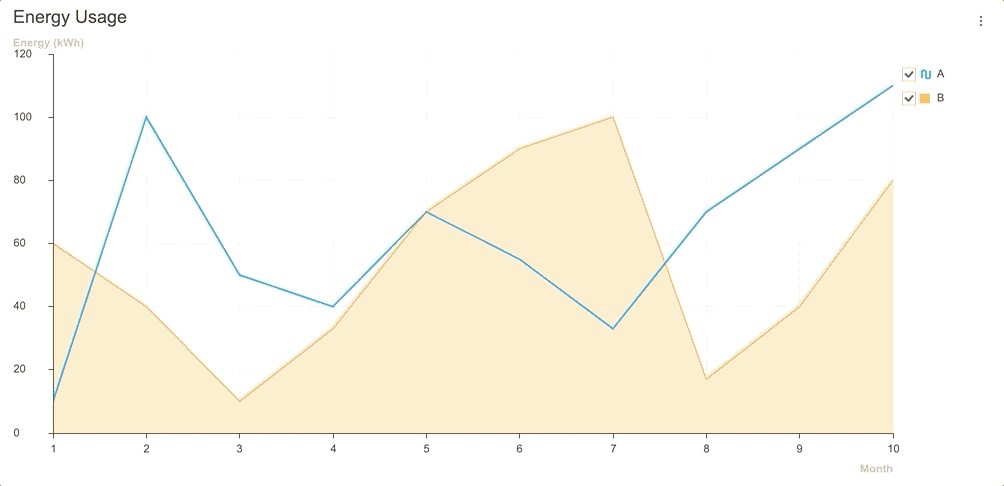
Make the data presented in the Line, Area, and Treemap Charts zoomable with the zoomable option.

Live Update
View and manage new data as they are added realtime with the addData API and the options.series.shift option.
| Area | Line | Heatmap |
|--- | --- | --- |
|  |
|  |
|  |
|
| LineArea | Column | ColumnLine |
|--- | --- | --- |
|  |
|  |
|  |
|
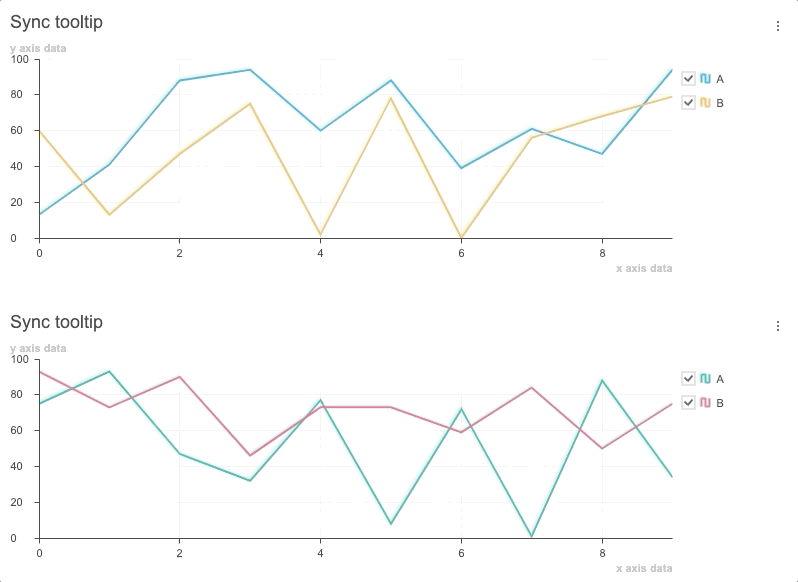
Synchronize Tooltip
Use and synchronize the tooltip features at the moment the cursor hovers over the chart with the showTooltip API and the on custom event.
🎨 Features
Charts
The TOAST UI Chart provides many types of charts to visualize the various forms of data.
| Area | Line | Bar | Column | | ------------------------------------------------------------------------------------------------------------------------------------------------ | ----------------------------------------------------------------------------------------------------------------------------------------------- | ---------------------------------------------------------------------------------------------------------------------------------------------- | -------------------------------------------------------------------------------------------------------------------------------------------------- | | <img src="https://user-images.githubusercontent.com/35371660/104139606-15ec5b80-53f0-11eb-96f6-c5bc593d9603.png" width="300" alt='area chart'/> | <img src="https://user-images.githubusercontent.com/35371660/104139669-65328c00-53f0-11eb-9612-c457a0cdaf9f.png" width="300" alt='line chart'/> | <img src="https://user-images.githubusercontent.com/35371660/104140066-d2dfb780-53f2-11eb-8bba-355cb22bc35c.png" width="300" alt='bar chart'/> | <img src="https://user-images.githubusercontent.com/35371660/104139953-1259d400-53f2-11eb-8d48-2a48d4cfe6b2.png" width="300" alt='column chart'/> |
| Bullet | BoxPlot | Treemap | Heatmap | | ------------------------------------------------------------------------------------------------------------------------------------------------- | -------------------------------------------------------------------------------------------------------------------------------------------------- | -------------------------------------------------------------------------------------------------------------------------------------------------- | -------------------------------------------------------------------------------------------------------------------------------------------------- | | <img src="https://user-images.githubusercontent.com/35371660/104140183-76c96300-53f3-11eb-88c7-49c212d9e31b.png" width="300" alt='bullet chart'/> | <img src="https://user-images.githubusercontent.com/35371660/104140209-a6786b00-53f3-11eb-8ff0-ade619a89ff4.png" width="300" alt='boxplot chart'/> | <img src="https://user-images.githubusercontent.com/35371660/104140267-fd7e4000-53f3-11eb-878a-4eb24b4b83de.png" width="300" alt='treemap chart'/> | <img src="https://user-images.githubusercontent.com/35371660/104140300-243c7680-53f4-11eb-9c92-465355e34211.png" width="300" alt='heatmap chart'/> |
| Scatter | Bubble | Radar | Pie | | -------------------------------------------------------------------------------------------------------------------------------------------------- | ------------------------------------------------------------------------------------------------------------------------------------------------- | ------------------------------------------------------------------------------------------------------------------------------------------------ | ---------------------------------------------------------------------------------------------------------------------------------------------- | | <img src="https://user-images.githubusercontent.com/35371660/104156462-6c778b00-542c-11eb-9101-a9df4e48d8db.png" width="300" alt='scatter chart'/> | <img src="https://user-images.githubusercontent.com/35371660/104156347-3508de80-542c-11eb-805e-fca276bc6c5f.png" width="300" alt='bubble chart'/> | <img src="https://user-images.githubusercontent.com/35371660/104140534-176c5280-53f5-11eb-830e-574b05fbf4db.png" width="300" alt='radar chart'/> | <img src="https://user-images.githubusercontent.com/35371660/104140544-2eab4000-53f5-11eb-87c3-d2bc9790fa5b.png" width="300" alt='pie chart'/> |
| LineArea | LineScatter
Related Skills
node-connect
342.0kDiagnose OpenClaw node connection and pairing failures for Android, iOS, and macOS companion apps
frontend-design
84.7kCreate distinctive, production-grade frontend interfaces with high design quality. Use this skill when the user asks to build web components, pages, or applications. Generates creative, polished code that avoids generic AI aesthetics.
openai-whisper-api
342.0kTranscribe audio via OpenAI Audio Transcriptions API (Whisper).
commit-push-pr
84.7kCommit, push, and open a PR
