Msmexplorer
Data visualizations for biomolecular dynamics
Install / Use
/learn @msmbuilder/MsmexplorerREADME
MSMExplorer: data visualizations for biomolecular dynamics

![]()
![]()
![]()

![]()
MSMExplorer is a Python visualization library for statistical models of biomolecular dynamics. It provides a high-level interface for drawing attractive statistical graphics with MSMBuilder.
Documentation
Online documentation is available here. It includes IPython notebooks, detailed API documentation, and other useful info.
There are docs for the development version here. These should correspond with the github master branch.
Examples
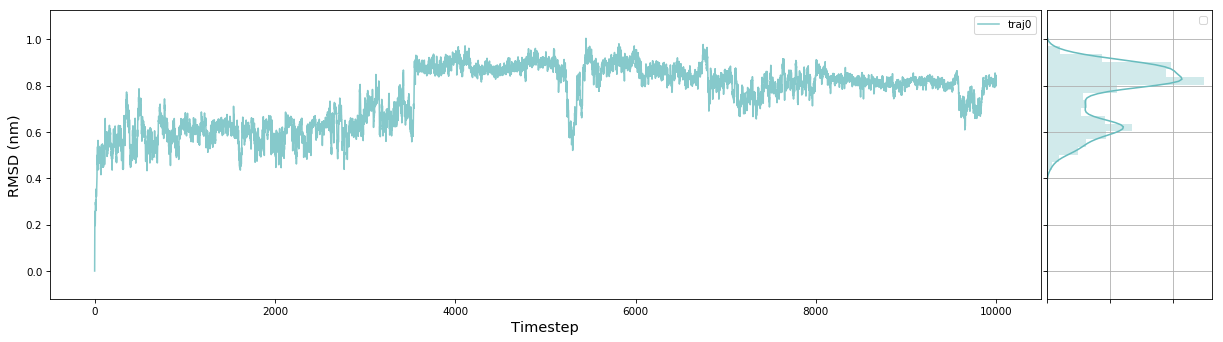
from msmbuilder.example_datasets import FsPeptide
from msmbuilder.featurizer import RMSDFeaturizer

import msmexplorer as msme

# Load Fs Peptide Data
traj = FsPeptide().get().trajectories[0]

# Calculate RMSD
featurizer = RMSDFeaturizer(reference_traj=traj[0])
rmsd = featurizer.partial_transform(traj).flatten()

# Plot Trace
msme.plot_trace(rmsd, label='traj0', xlabel='Timestep', ylabel='RMSD (nm)')
The documentation has an example gallery with short scripts showing how to use different parts of the package.
Dependencies
- Python 3.4+
Mandatory
The latest versions of the following packages are required:
Installation
The preferred installation mechanism for msmexplorer is with conda:
$ conda install -c omnia msmexplorer
If you don't have conda, or are new to scientific python, we recommend that you download the Anaconda scientific python distribution.
To install from PyPI, just do:
pip install msmexplorer
You may instead want to use the development version from Github, by running
pip install git+git://github.com/msmexplorer/msmexplorer.git#egg=msmexplorer
Development
All development happens here, on Github.
If you're interested in contributing to MSMExplorer, please refer to our Contributing guide.
Support
Please submit any bugs or questions to the Github issue tracker.
License
Released under a MIT license
Citing
@article{msmexplorer,
  doi = {10.21105/joss.00188},
  url = {https://doi.org/10.21105%2Fjoss.00188},
  year  = {2017},
  month = {apr},
  publisher = {The Open Journal},
  volume = {2},
  number = {12},
  author = {Carlos X. Hern{\'{a}}ndez and Matthew P. Harrigan and Mohammad M. Sultan and Vijay S. Pande},
  title = {{MSMExplorer}: Data Visualizations for Biomolecular Dynamics},
  journal = {The Journal of Open Source Software}
}
Related Skills
node-connect
349.9kDiagnose OpenClaw node connection and pairing failures for Android, iOS, and macOS companion apps
claude-opus-4-5-migration
109.8kMigrate prompts and code from Claude Sonnet 4.0, Sonnet 4.5, or Opus 4.1 to Opus 4.5
frontend-design
109.8kCreate distinctive, production-grade frontend interfaces with high design quality. Use this skill when the user asks to build web components, pages, or applications. Generates creative, polished code that avoids generic AI aesthetics.
model-usage
349.9kUse CodexBar CLI local cost usage to summarize per-model usage for Codex or Claude, including the current (most recent) model or a full model breakdown. Trigger when asked for model-level usage/cost data from codexbar, or when you need a scriptable per-model summary from codexbar cost JSON.
