Yagd
super simple dashboard framework in PHP
Install / Use
/learn @mrtazz/YagdREADME
yagd

![]()

![]()
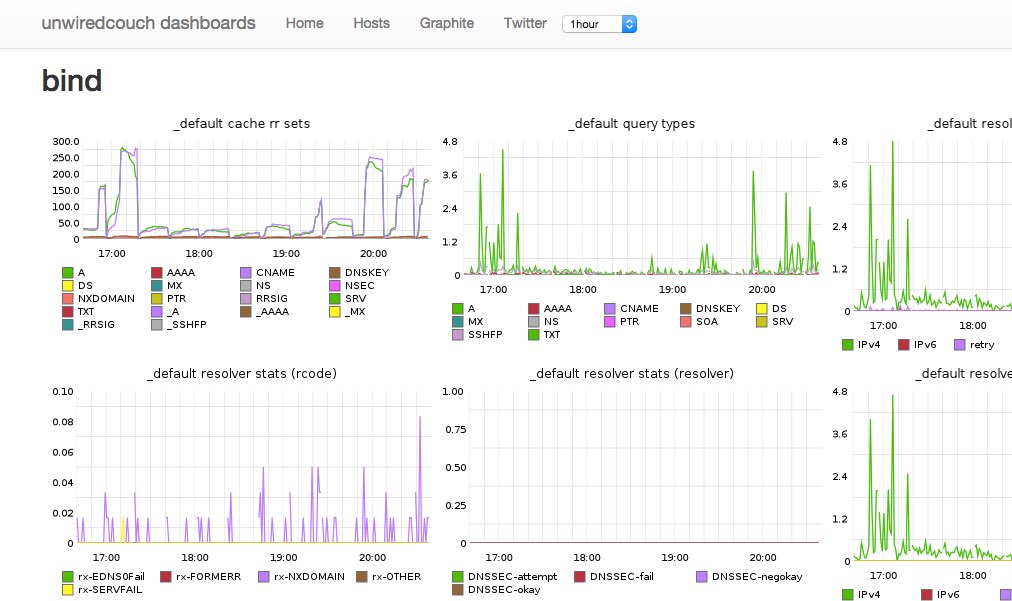
Overview
Yet Another Graphite Dashboard - because why not? It's heavily inspired by the Etsy dashboard framework but only provides a very small subset of features. If you have a lot of hosts or need advanced features I'd recommend checking that out.
Look
Requirements
- PHP >= 5.5
- Graphite
Installation
- in your dashboards repo, run:
composer require mrtazz/yagd - copy
config.example.phptoconfig.phpand adapt it - write php to create your dashboards
Usage examples
Generic dashboards
There is a generic Page.php class included which can just include all
Graphite graphs you have in an array called $metrics like this:
<?php

$metrics = array(
    'carbon.agents.foo_example_com-a.committedPoints',
    'carbon.agents.foo_example_com-a.cpuUsage',
    'carbon.agents.foo_example_com-a.avgUpdateTime',
    'carbon.agents.foo_example_com-a.creates',
    'carbon.agents.foo_example_com-a.errors',
    'carbon.agents.foo_example_com-a.metricsReceived',
    'carbon.agents.foo_example_com-a.pointsPerUpdate',
    'carbon.agents.foo_example_com-a.updateOperations',
);

$page = new Page($CONFIG);
$page->renderFullPageWithMetrics($metrics);
Display CollectD host data
If you are using collectd to gather system level graphs you can draw basic information onto a dashboard like this:
Configure hosts in your config.php
$CONFIG['hosts'] = [
        "foo.example.com" => [
            "cpus" => 2,
            "filesystems" => [ 'root', 'var', ]
            ],
            "additional_metrics" => [
                "disk temp" => [
                "disk temperature" => "collectd.foo_example_com.disktemp-ada*.current",
                ]
            ],
        ]
    ];
And then drop something like this into e.g. htdocs/hosts.php:
<?php

require __DIR__ . '/../vendor/autoload.php';

include_once("../config.php");

use Yagd\CollectdHost;
use Yagd\Page;

$page = new Page($CONFIG);
echo $page->getHeader($CONFIG["title"],
    $CONFIG["navitems"]);

foreach($CONFIG["hosts"] as $host => $data) {

    $fss = empty($data["filesystems"]) ? [] : $data["filesystems"];

    $server = new CollectdHost($host, $data["cpus"], $fss,
                               $data["interfaces"]);
    $server->setGraphiteConfiguration($CONFIG["graphite"]["host"]);
    echo "<h2> {$host} </h2>";
    $server->render();
}

echo $page->getFooter();
Inject a select box into the navbar
For the host page for example you might wanna have an easy way to only show one host. For that you can inject a select box into the header navbar like this:
<?php

$selectbox = "";
$selectbox .= "<form method='get' action='hosts.php' style='margin-top: 15px'class='pull-right'>";
$selectbox .= "   <select name='hostname' onchange='this.form.submit()'>";
    foreach ($CONFIG["hosts"] as $host => $data) {
        $selected = ($_GET["hostname"] == $host) ? "selected" : "";
        $selectbox .= "<option value='{$host}' {$selected}>{$host}</option>";
}
$selectbox .= "</select>";
$selectbox .= "</form>";

$page = new Page($CONFIG);
echo $page->getHeader($CONFIG["title"],
    $CONFIG["navitems"],
    $selectbox);

if (empty($_GET["hostname"])) {
    $hosts = $CONFIG["hosts"];
} else {
    $hosts = [ $_GET["hostname"] => $CONFIG["hosts"][$_GET["hostname"]] ];
}
This will show the content of $selectbox in the header and only show the
actually selected host (if one was selected) on the page.
Related Skills
node-connect
348.0kDiagnose OpenClaw node connection and pairing failures for Android, iOS, and macOS companion apps
frontend-design
108.8kCreate distinctive, production-grade frontend interfaces with high design quality. Use this skill when the user asks to build web components, pages, or applications. Generates creative, polished code that avoids generic AI aesthetics.
openai-whisper-api
348.0kTranscribe audio via OpenAI Audio Transcriptions API (Whisper).
qqbot-media
348.0kQQBot 富媒体收发能力。使用 <qqmedia> 标签,系统根据文件扩展名自动识别类型(图片/语音/视频/文件)。
