XChart
XChart is a light-weight Java library for plotting data.
Install / Use
/learn @knowm/XChartREADME
 XChart
XChart is a light-weight Java library for plotting data.
Description
XChart is a light-weight and convenient library for plotting data designed to go from data to chart in the least amount of time possible and to take the guess-work out of customizing the chart style.
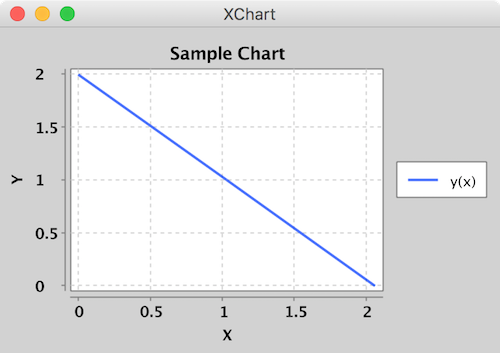
Simplest Example
Create a XYChart instance via QuickChart, add a series of data to it, and either display it or save it as a bitmap.
double[] xData = new double[]{0.0, 1.0, 2.0};
double[] yData = new double[]{2.0, 1.0, 0.0};

// Create Chart
XYChart chart = QuickChart.getChart("Sample Chart", "X", "Y", "y(x)", xData, yData);

// Show it
new SwingWrapper(chart).displayChart();

// Save it
BitmapEncoder.saveBitmap(chart, "./Sample_Chart",BitmapFormat.PNG);

// or save it in high-res
BitmapEncoder.saveBitmapWithDPI(chart, "./Sample_Chart_300_DPI",BitmapFormat.PNG, 300);
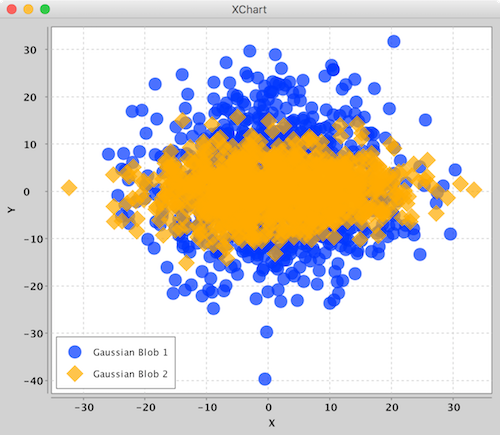
Intermediate Example
Create a XYChart via a XYChartBuilder, style chart, add a series to it, style series, and display chart.
// Create Chart
XYChart chart = new XYChartBuilder().width(600).height(500).title("Gaussian Blobs").xAxisTitle("X").yAxisTitle("Y").build();

// Customize Chart
chart.getStyler().setDefaultSeriesRenderStyle(XYSeriesRenderStyle.Scatter);
chart.getStyler().setChartTitleVisible(false);
chart.getStyler().setLegendPosition(LegendPosition.InsideSW);
chart.getStyler().setMarkerSize(16);

// Series
chart.addSeries("Gaussian Blob 1",getGaussian(1000, 1,10),getGaussian(1000,1,10));
XYSeries series = chart.addSeries("Gaussian Blob 2", getGaussian(1000, 1, 10), getGaussian(1000, 0, 5));
series.setMarker(SeriesMarkers.DIAMOND);

new SwingWrapper(chart).displayChart();
Advanced Example
Create a XYChart via a XYChartBuilder, style chart, add a series to it, add chart to XChartPanel, embed in Java Swing App, and display GUI.
// Create Chart
final XYChart chart = new XYChartBuilder().width(600).height(400).title("Area Chart").xAxisTitle("X").yAxisTitle("Y").build();

// Customize Chart
chart.getStyler().setLegendPosition(LegendPosition.InsideNE);
chart.getStyler().setDefaultSeriesRenderStyle(XYSeriesRenderStyle.Area);

// Series
chart.addSeries("a",new double[] { 0, 3, 5, 7, 9},new double[]{-3,5,9,6,5});
chart.addSeries("b",new double[] { 0, 2, 4, 6, 9},new double[]{-1,6,4,0,4});
chart.addSeries("c",new double[] { 0, 1, 3, 8, 9},new double[]{-2,-1,1,0,1});

// Schedule a job for the event-dispatching thread:
// creating and showing this application's GUI.
        javax.swing.SwingUtilities.

invokeLater(new Runnable() {

    @Override
    public void run () {

        // Create and set up the window.
        JFrame frame = new JFrame("Advanced Example");
        frame.setLayout(new BorderLayout());
        frame.setDefaultCloseOperation(JFrame.EXIT_ON_CLOSE);

        // chart
        JPanel chartPanel = new XChartPanel<XYChart>(chart);
        frame.add(chartPanel, BorderLayout.CENTER);

        // label
        JLabel label = new JLabel("Blah blah blah.", SwingConstants.CENTER);
        frame.add(label, BorderLayout.SOUTH);

        // Display the window.
        frame.pack();
        frame.setVisible(true);
    }
});
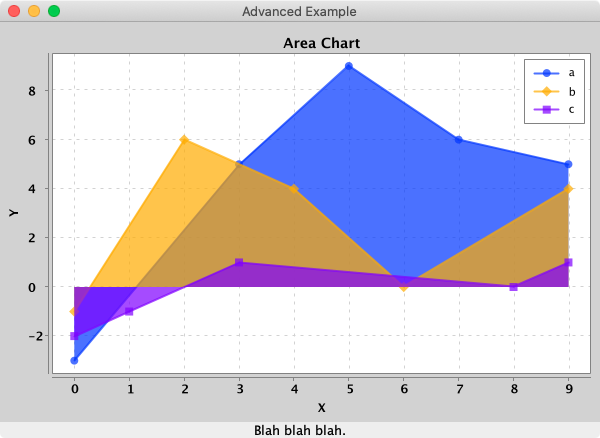
To make it real-time, simply call updateXYSeries on the XYChart instance to update the series data, followed by revalidate() and repaint() on the XChartPanel instance to
repaint.
Features
- [x] No required additional dependencies
- [x] Multiple Y-Axis charts
- [x] Line charts
- [x] Step charts
- [x] Scatter charts
- [x] Area charts
- [x] Step Area charts
- [x] Bar charts
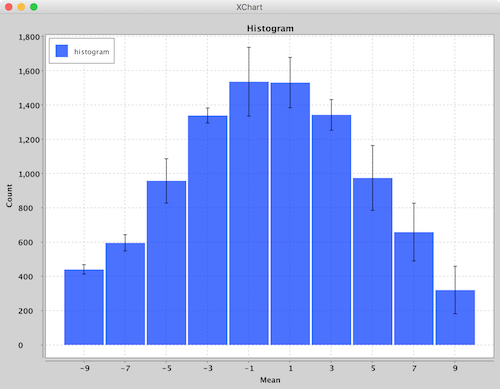
- [x] Histogram charts
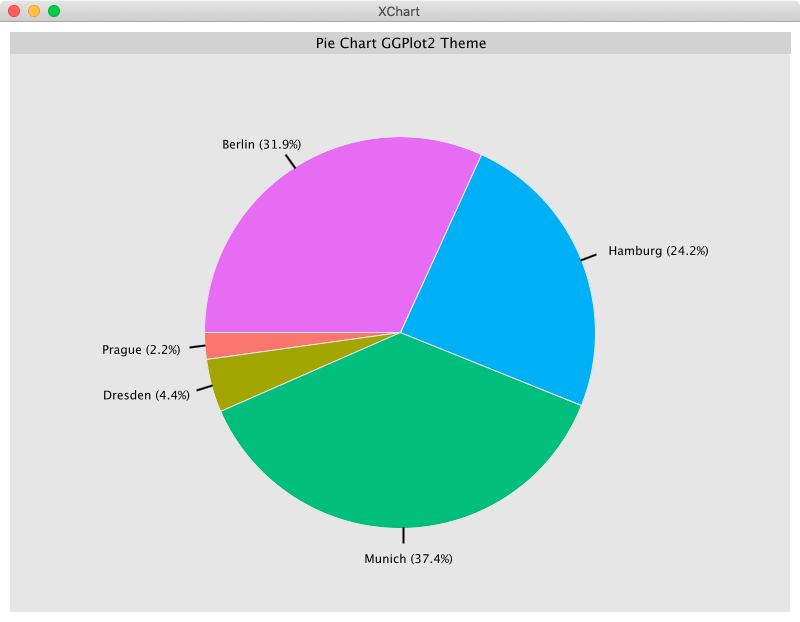
- [x] Pie charts
- [x] Donut charts
- [x] Bubble charts
- [x] Stick charts
- [x] Dial charts
- [x] Radar charts
- [x] OHLC charts
- [x] Box charts
- [x] Heat maps
- [x] Error bars
- [x] Logarithmic axes
- [x] Number, Date, Bubble and Category X-Axis
- [x] Multiple series
- [x] Tool tips
- [x] Extensive customization
- [x] Themes - XChart, GGPlot2, Matlab
- [x] Right-click, Save-As...
- [x] User-defined axes range
- [x] Definable legend placement
- [x] CSV import and export
- [x] High resolution chart export
- [x] Export as PNG, JPG, BMP, GIF with custom DPI setting
- [x] Export SVG, EPS using optional
de.erichseifert.vectorgraphics2dlibrary - [x] Export PDF using optional
pdfbox-graphics2dlibrary - [x] Real-time charts
- [x] Java 8 and up
Chart Types
Currently, there are 5 major chart types. Each type has its corresponding ChartBuilder, Styler and Series.
| Chart Type | Builder | Styler | Series | Allowed Data Types | Default Series Render Style | |---------------|----------------------|----------------|----------------|----------------------|-----------------------------| | XYChart | XYChartBuilder | XYStyler | XYSeries | Number, Date | Line | | CategoryChart | CategoryChartBuilder | CategoryStyler | CategorySeries | Number, Date, String | Bar | | PieChart | PieChartBuilder | PieStyler | PieSeries | String | Pie | | BubbleChart | BubbleChartBuilder | BubbleStyler | BubbleSeries | Number, Date | Round | | DialChart | DialChartBuilder | DialStyler | DialSeries | double | Round | | RadarChart | RadarChartBuilder | RadarStyler | RadarSeries | double[] | Round | | OHLCChart | OHLCChartBuilder | OHLCStyler | OHLCSeries | OHLC with Date | Candle | | BoxChart | BoxChartBuilder | BoxStyler | BoxSeries | Number, Date, String | Box | | HeatMapChart | HeatMapChartBuilder | HeatMapStyler | HeatMapSeries | Number, Date, String | -- |
The different Stylers contain chart styling methods specific to the corresponding chart type as well as common styling methods common across all chart types.
XYChart
XYChart charts take Date or Number data types for the X-Axis and Number data types for the Y-Axis. For both axes, the tick marks are auto generated to span the range and domain
of the data in evenly-spaced intervals.
Series render styles include: Line, Scatter, Area, Step and StepArea.
CategoryChart
CategoryChart charts take Date, Number or String data types for the X-Axis and Number data types for the Y-Axis. For the X-Axis, each category is given its own tick mark.
Series render styles include: Bar, Line, Scatter, Area and Stick.
PieChart
PieChart charts take String data types for the pie slice name and Number data types for the pie slice value.
Series render styles include: Pie and Donut.
BubbleChart
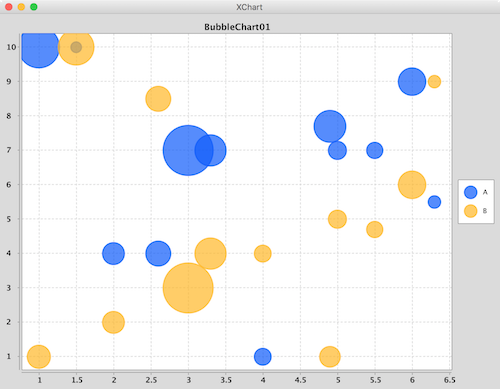
BubbleChart charts take Date or Number data types for the X-Axis and Number data types for the Y-Axis and bubble sizes.
Series render styles include: Round and in the near future Square.
DialChart
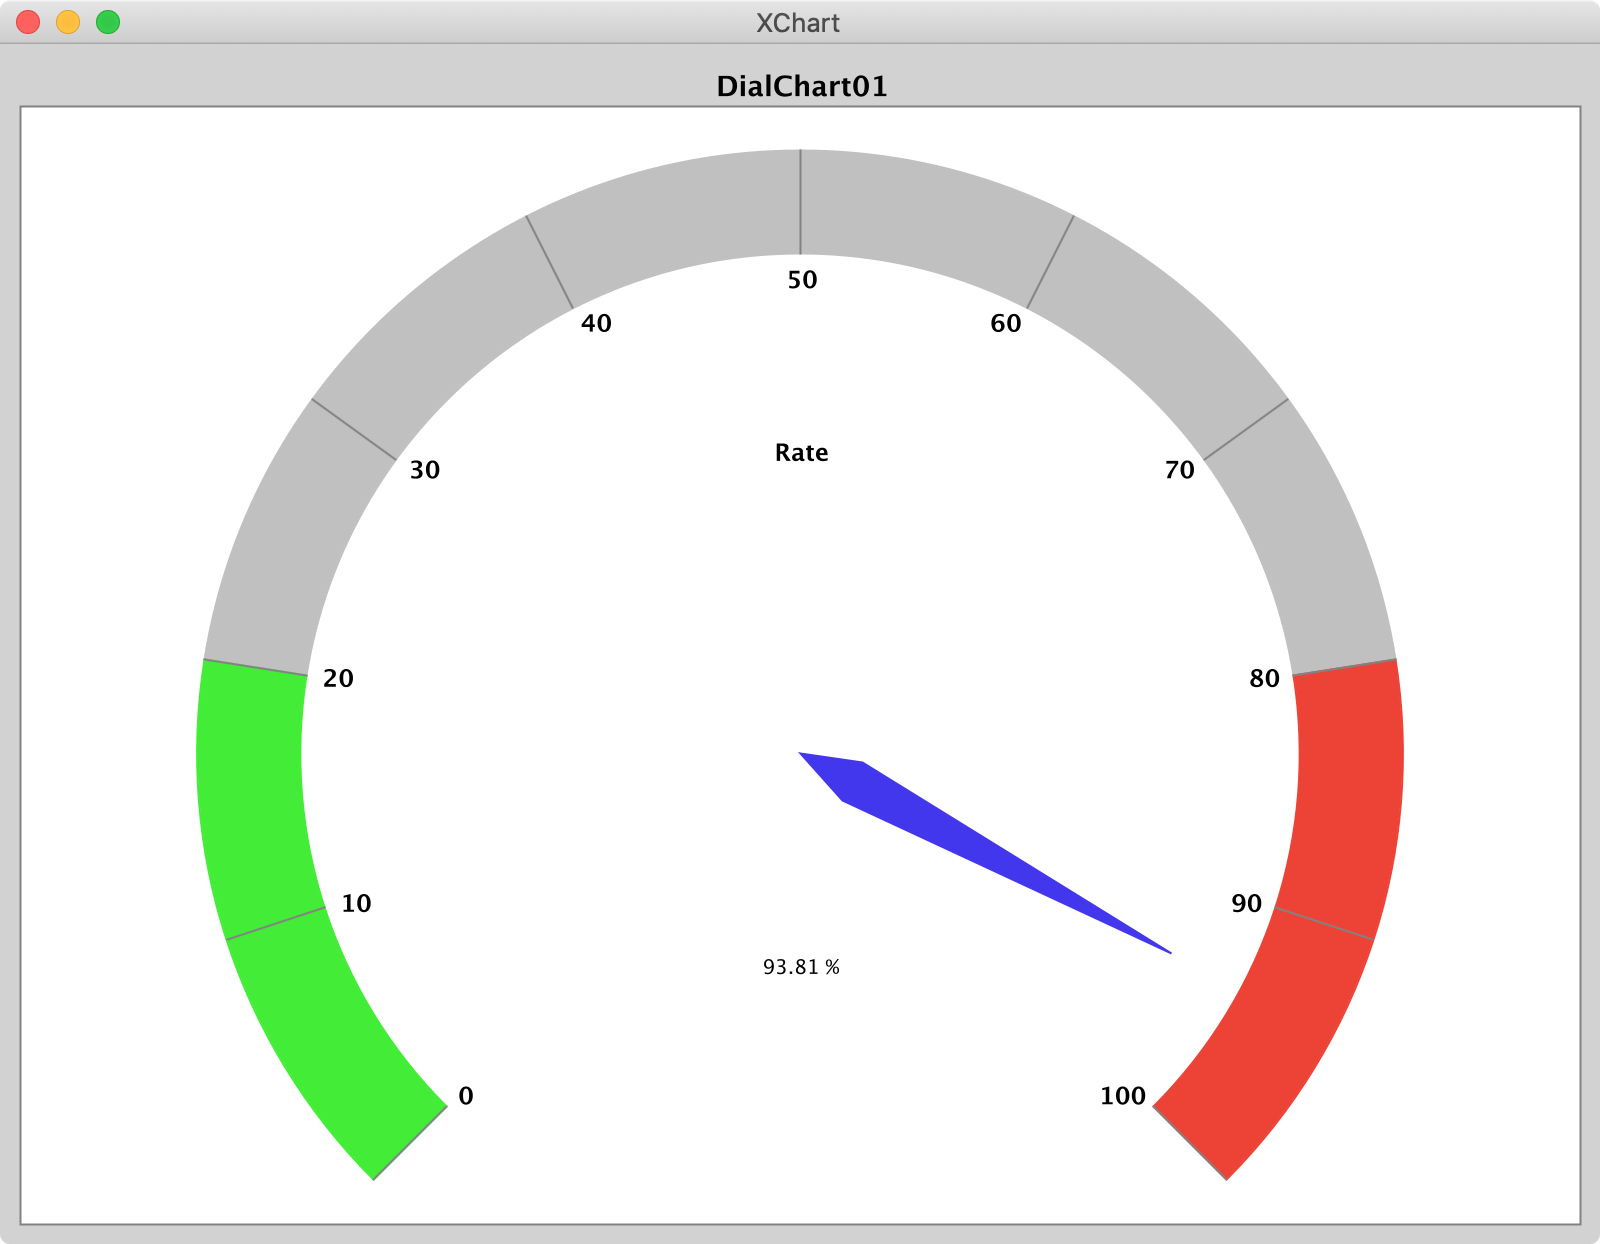
DialChart charts take a double to set the position of the dial pointer and a String to set the label. Extensive customization is possible.
RadarChart
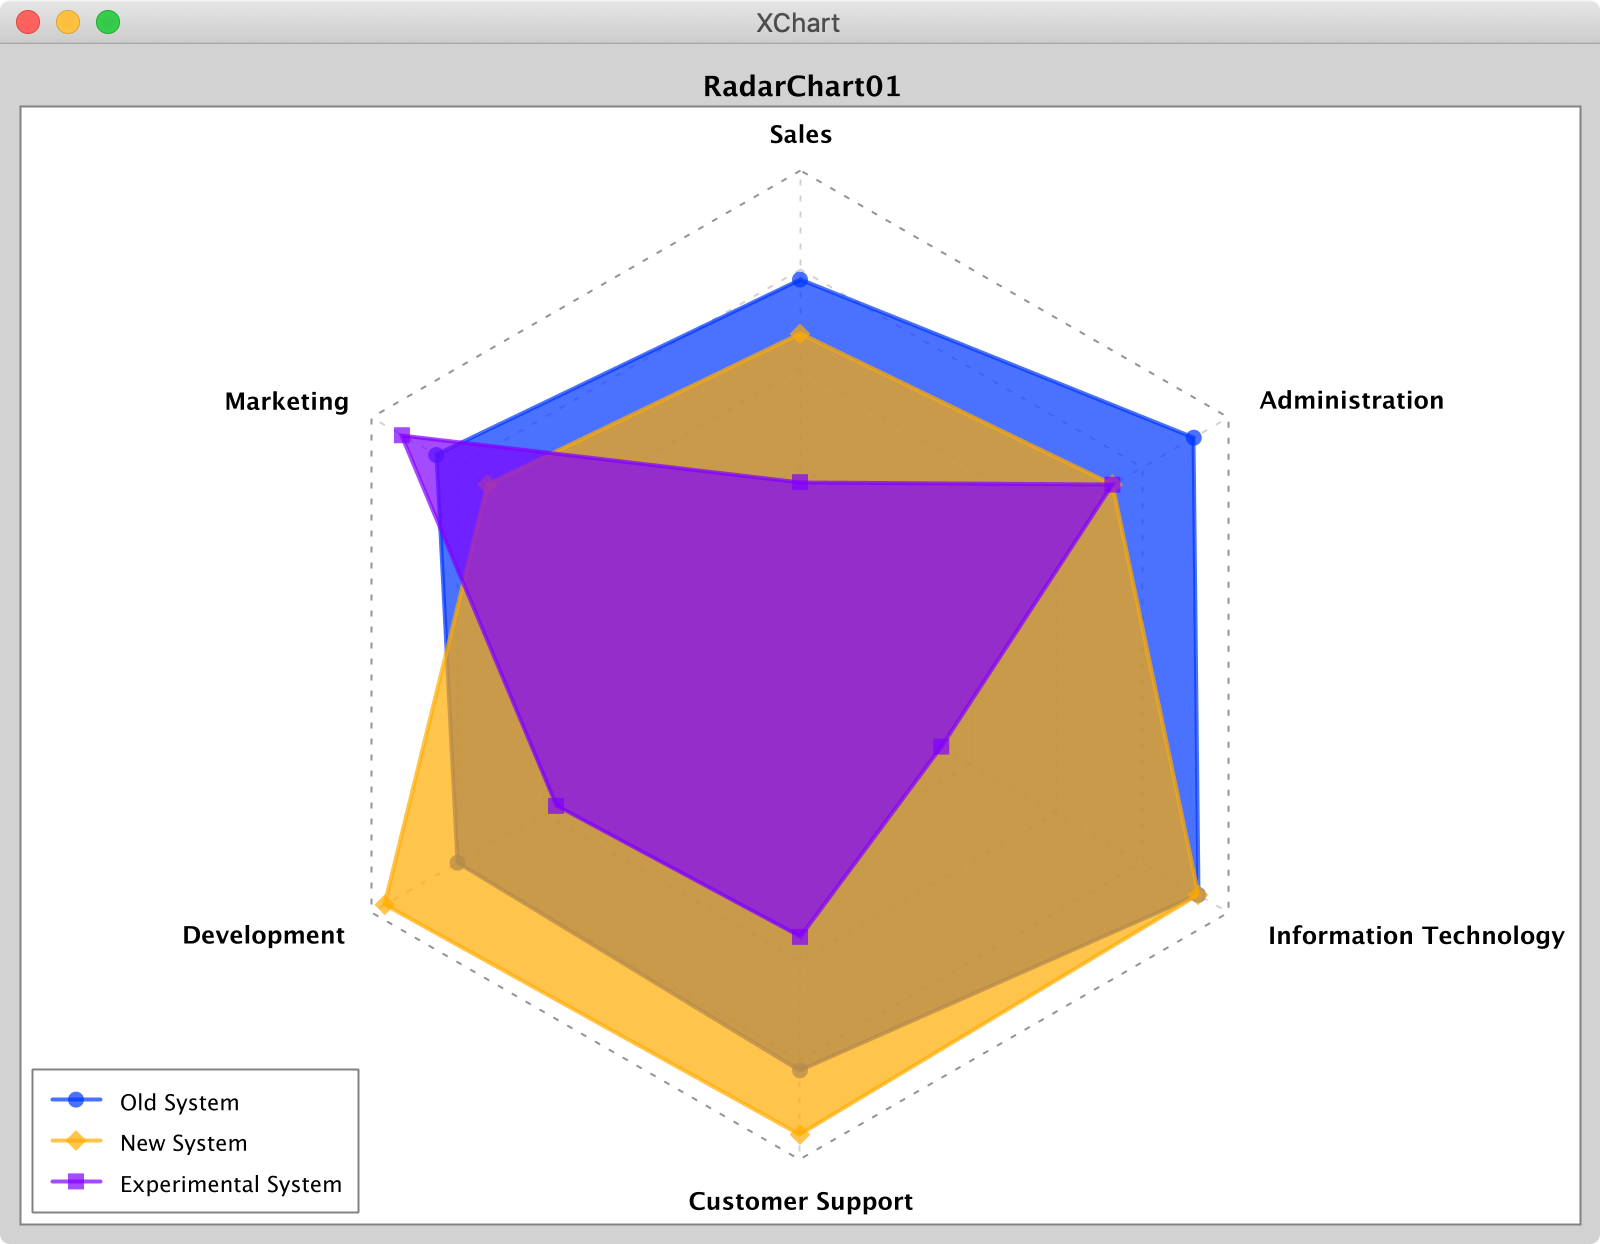
RadarChart charts take a double[] of values between 0.0. and 1.0 to set the position of the series' data point along each radii. Radii
labels, if displayed, are set by passing a String[].
Radar chart render styles are: Polygon or Circle.
OHLCChart
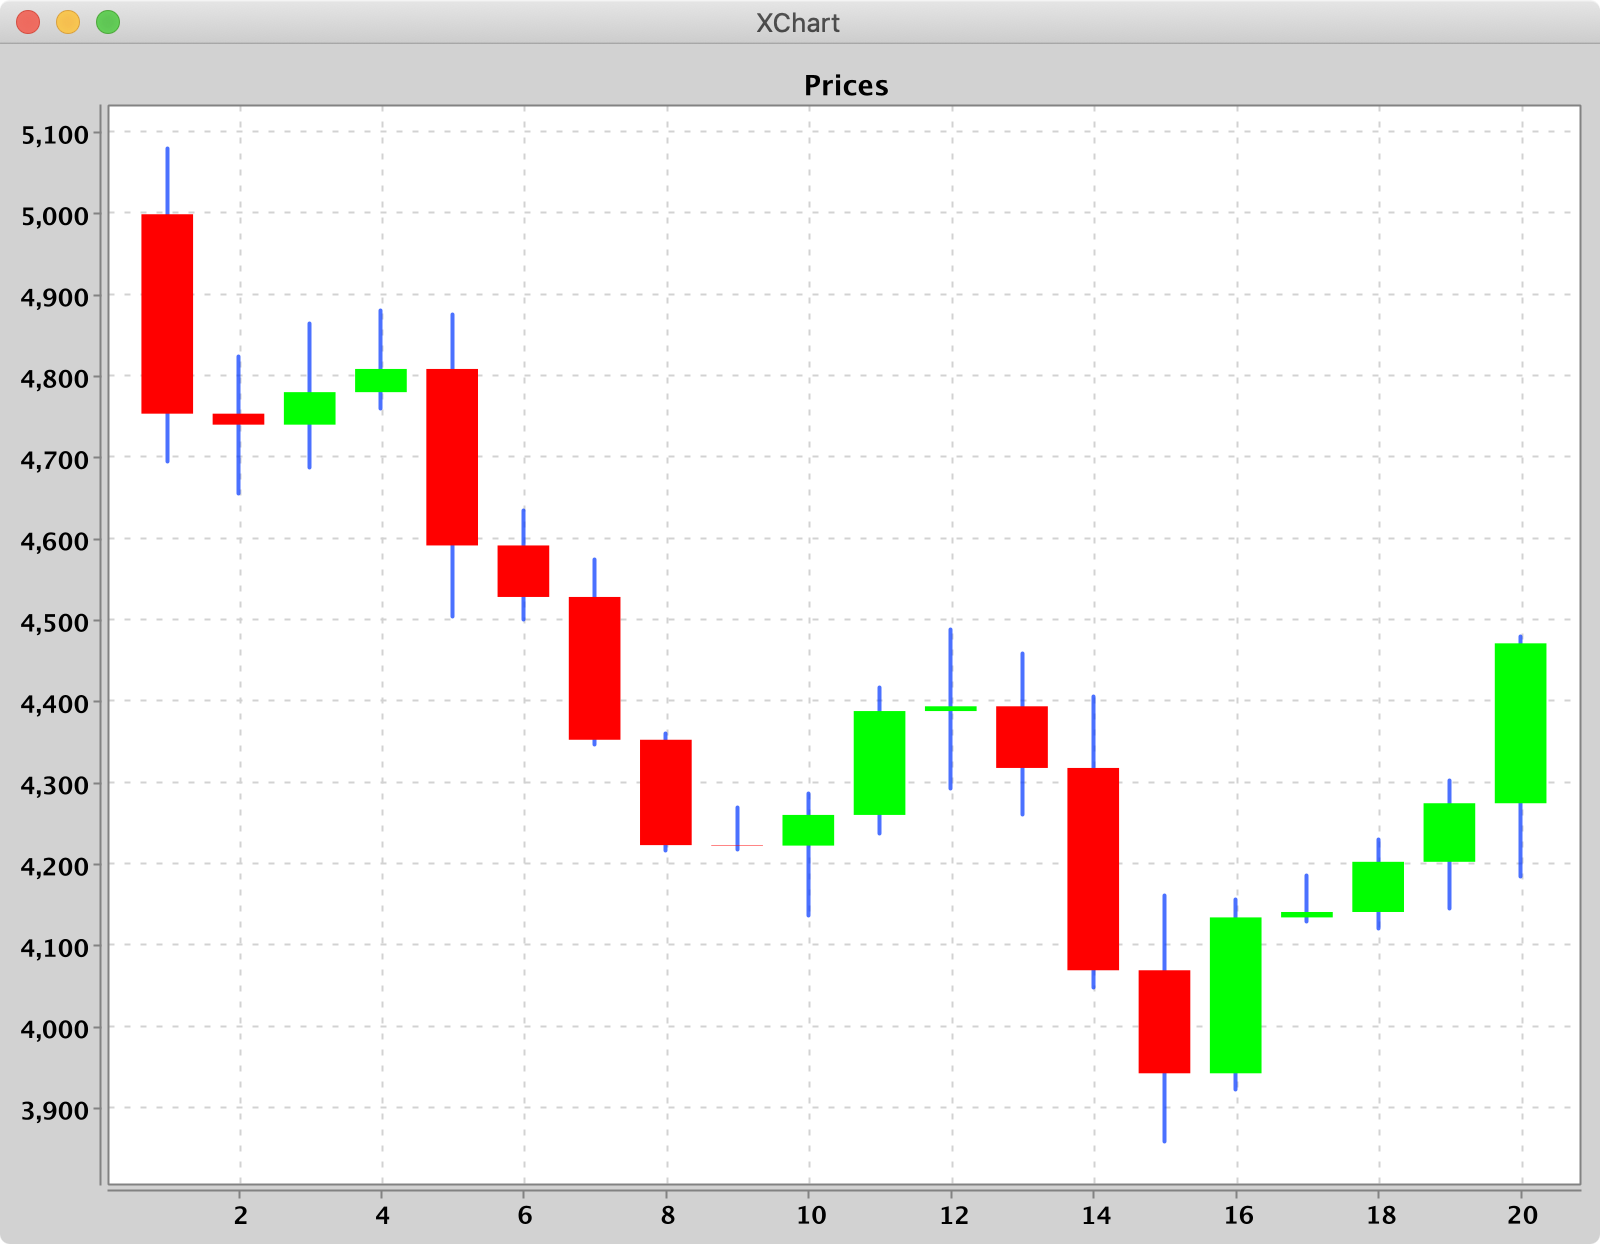
OHLCChart charts take Date data types for the X-Axis and 4 Number data types for the Y-Axis. For both axes, the tick marks are auto generated to span the range and domain of the
data in evenly-spaced intervals.
Series render styles include: Candle, HiLo.
BoxChart
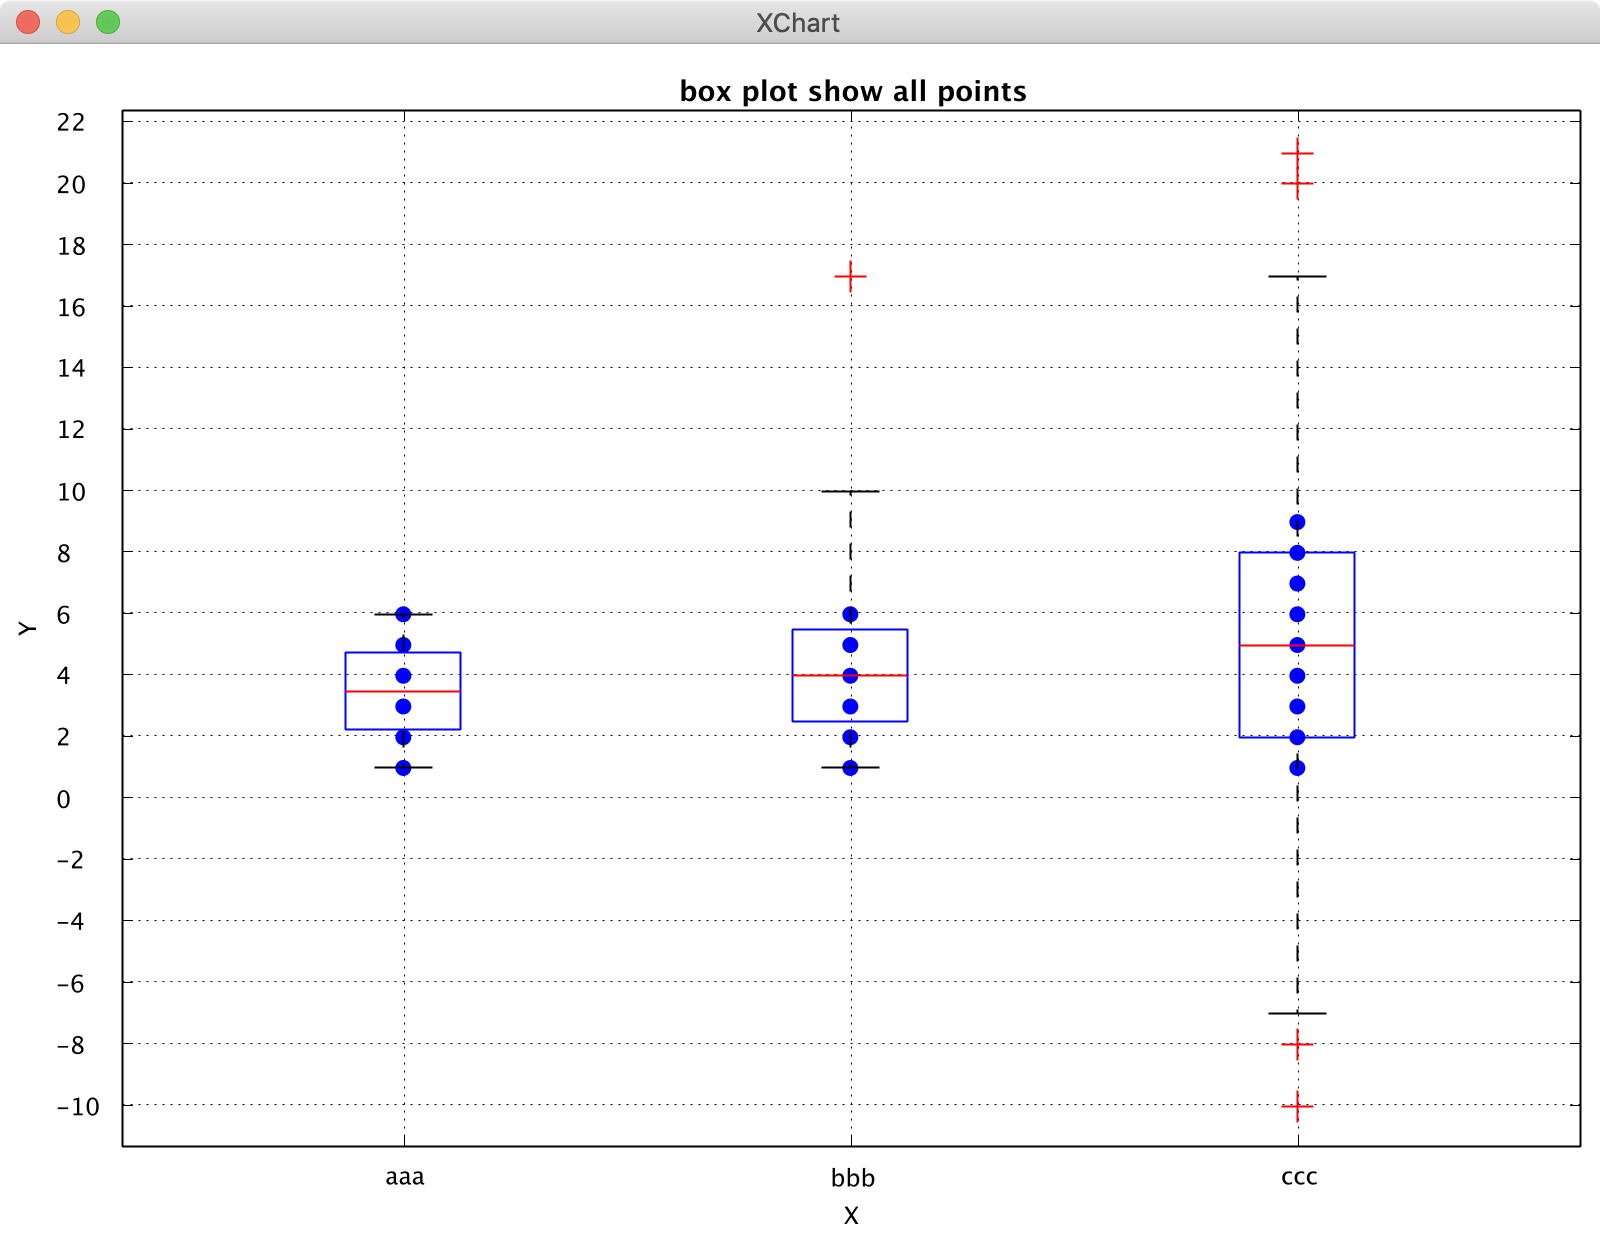
BoxChart charts take String data (seriesNames) types for the X-Axis and Number data types for the Y-Axis. Each box chart is calculated from the corresponding series yData.
Create a BoxChart via a BoxChartBuilder, style chart, add a series to it.
// Create Chart
BoxChart chart =
        new BoxChartBuilder().title("box plot demo").build();

// Choose a calculation method
chart.getStyler().setBoxplotCalCulationMethod(BoxplotCalCulationMethod.N_LESS_1_PLUS_1);
chart.getStyler().setToolTipsEnabled(true);

// Series
chart.addSeries("boxOne",Arrays.asList(1,2,3,4));
new SwingWrapper<BoxChart>(chart).displayChart();
Four calculation methods for boxplots:
- "N_PLUS_1": determine the position of the quartile, where Qi is = i (n + 1) / 4, where i = 1, 2, and 3. n represents the number of items contained in the sequence. Calculate the corresponding quartile based on location.
- "N_LESS_1": Determine the position of the quartile, where Qi is = i (n-1) / 4, where i = 1, 2, and 3. n represents the number of items contained in the sequence. Calculate the corresponding quartile based on location.
- "NP": Determine the position of the quartil
