Clustergrammer2
"Dimensionality-increasing" data visualization tool and interactive WebGL Jupyter widget built for single-cell data.
Install / Use
/learn @ismms-himc/Clustergrammer2README
![]()

Clustergrammer2 is an interactive heatmap Jupyter widget built using the widget-ts-cookiecutter library and the WebGL library regl. Clustergrammer2 is built to help researchers interactively explore single cell data (e.g. scRNA-seq). Please see Case Studies and Tutorials for examples.
Clustergrammer2 Examples
Basic Example of Running Clustergrammer2 on MyBinder
![]()
![]()
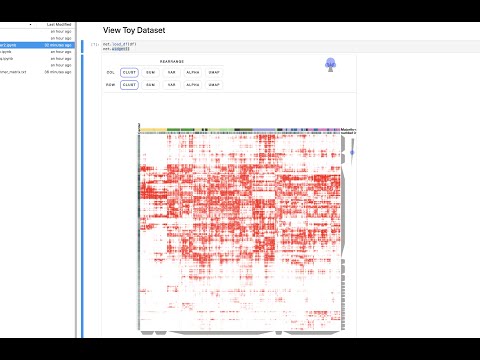
The above notebook shows how Clustergrammer2 can be used to load a small dataset and visualize a large random DataFrame. By running the notebook on MyBinder using Jupyter Lab it can also be used to visualize a user uploaded dataset. Please see the video tutorial above for more information.
For additional examples and tutorials please see:
- Case Studies and Tutorials
- Clustergrammer2-Notebooks GitHub repository
2,700 PBMC scRNA-seq
![]()
![]()
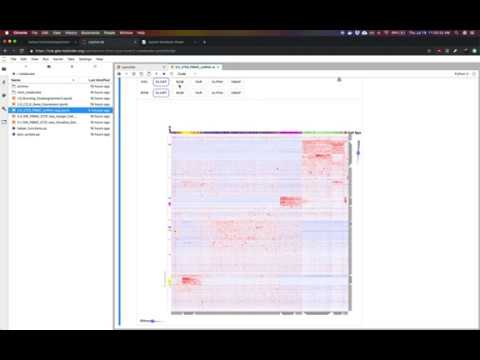
Single cell RNA-seq (scRNA-seq) is a powerful method to interrogate gene expression across th
Related Skills
node-connect
349.0kDiagnose OpenClaw node connection and pairing failures for Android, iOS, and macOS companion apps
claude-opus-4-5-migration
109.4kMigrate prompts and code from Claude Sonnet 4.0, Sonnet 4.5, or Opus 4.1 to Opus 4.5
frontend-design
109.4kCreate distinctive, production-grade frontend interfaces with high design quality. Use this skill when the user asks to build web components, pages, or applications. Generates creative, polished code that avoids generic AI aesthetics.
model-usage
349.0kUse CodexBar CLI local cost usage to summarize per-model usage for Codex or Claude, including the current (most recent) model or a full model breakdown. Trigger when asked for model-level usage/cost data from codexbar, or when you need a scriptable per-model summary from codexbar cost JSON.
