InspectIT
(UNMAINTAINED) inspectIT is the leading Open Source APM (Application Performance Management) tool for analyzing your Java (EE) applications.
Install / Use
/learn @inspectIT/InspectITREADME
| :fire: inspectIT OpenCensus Edition has been released :fire: | | --- | | The inspectIT OCE project provides an improved Java agent newly developed from scratch focusing on scalability, compatibility, flexibility and interaction with other awesome open source tools and frameworks. <br /><br /> :small_orange_diamond: Check it out: inspectIT OpenCensus Edition |
![]()
inspectIT

inspectIT is the leading Open Source APM (application performance management) tool for monitoring and analyzing your Java(EE) software applications.
Various sensors capture end-to-end information for every request from the end user, to the business tier all the way to the backends. inspectIT is based on an application-centric, business-focused approach, where each technical request is mapped to an application and to a business use-case. With inspectIT you always know about the health of your software and can easily analyze any problems that arise.
For Web applications the tool integrates the End user monitoring using automatic JavaScript agent injection. This allows easy monitoring of the performance that real users are facing in the browser. In addition, the inspectIT can correlate all user actions in the browser to the backend traces, thus providing a complete picture on the user experience.
We hope that together we can build an alternative to the (great!) commercial tools available so that it is up the end user to choose his tooling. Let's make inspectIT even more awesome!
| :mega: Road-Map Announcement | | --- | | The inspectIT team would like to inform the public and our open source community about the future plans for our beloved APM tool and the planned roadmap. You can read more in our public announcment. |
Features
| See all requests | Trace-based analysis | Remote traces | Details (SQL) |
| --- | --- | --- | --- |
|  |
|  |
|  |
|  |
|
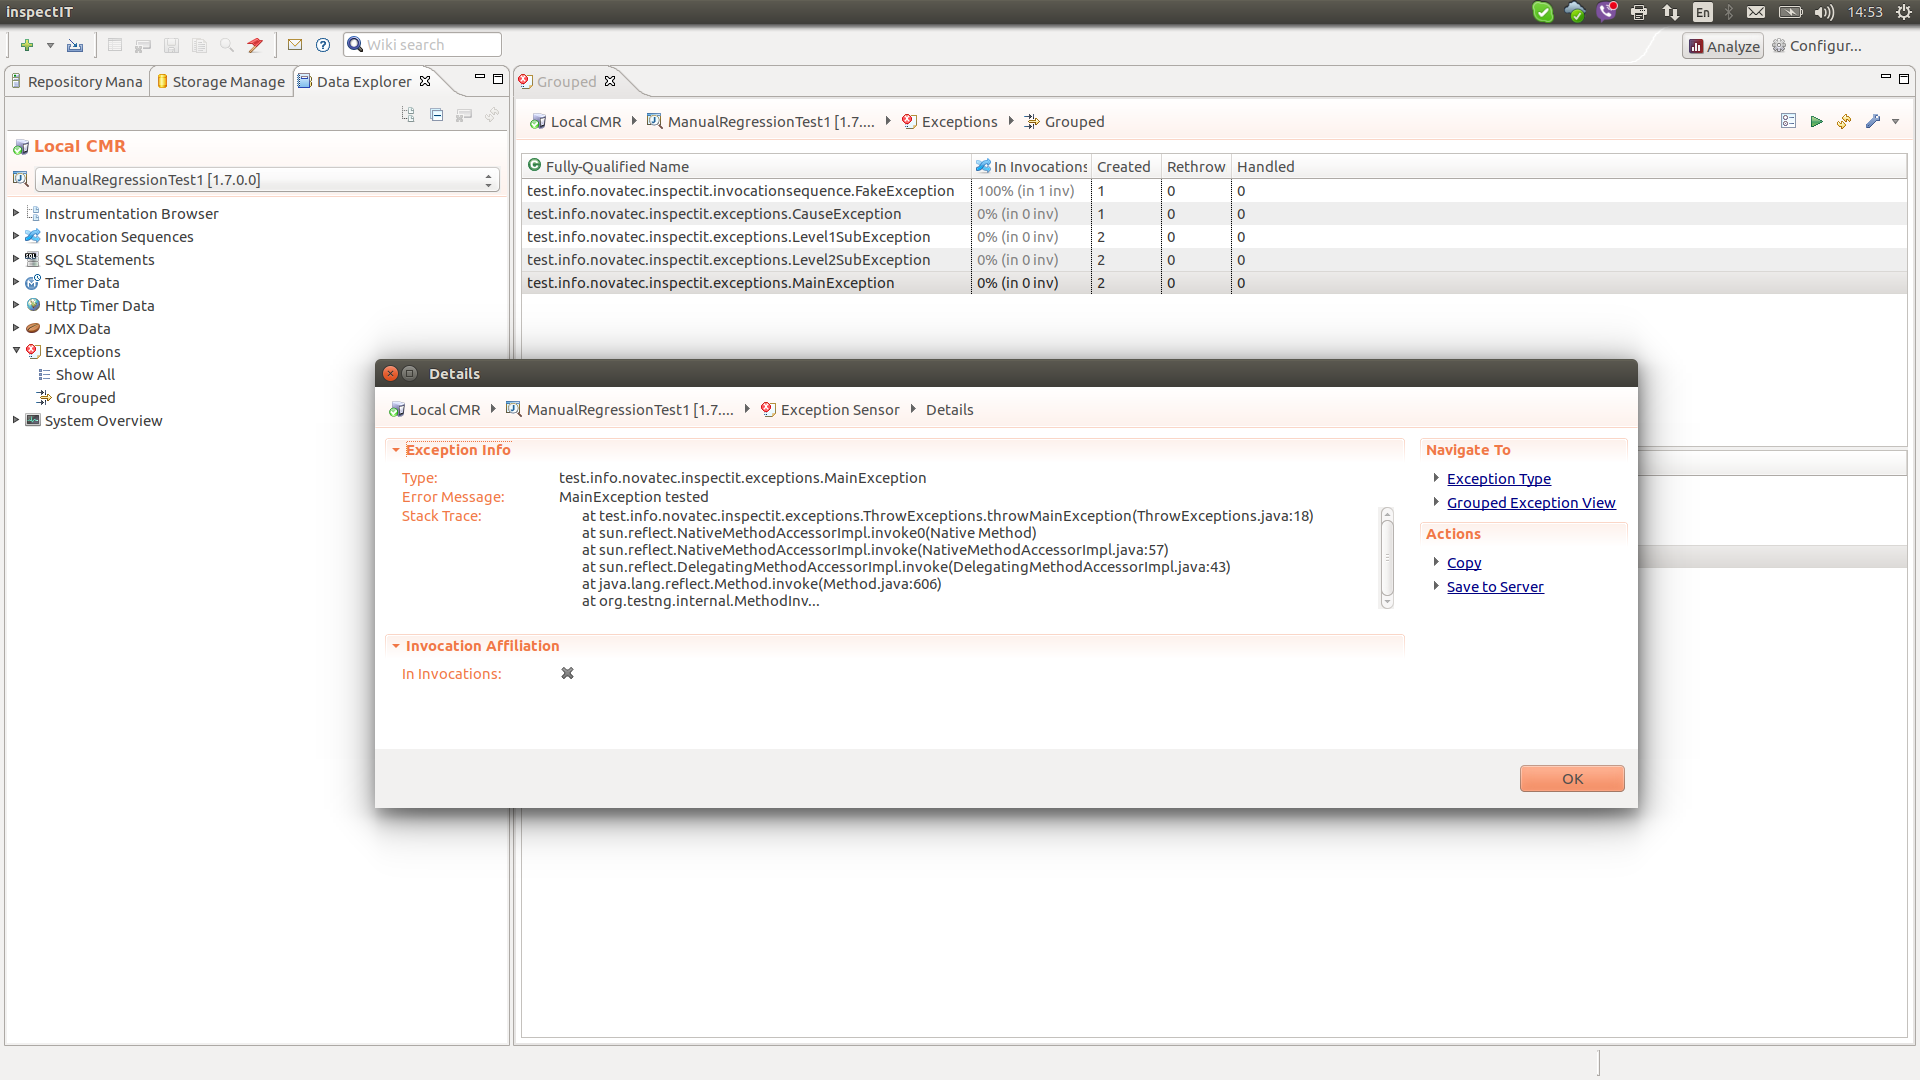
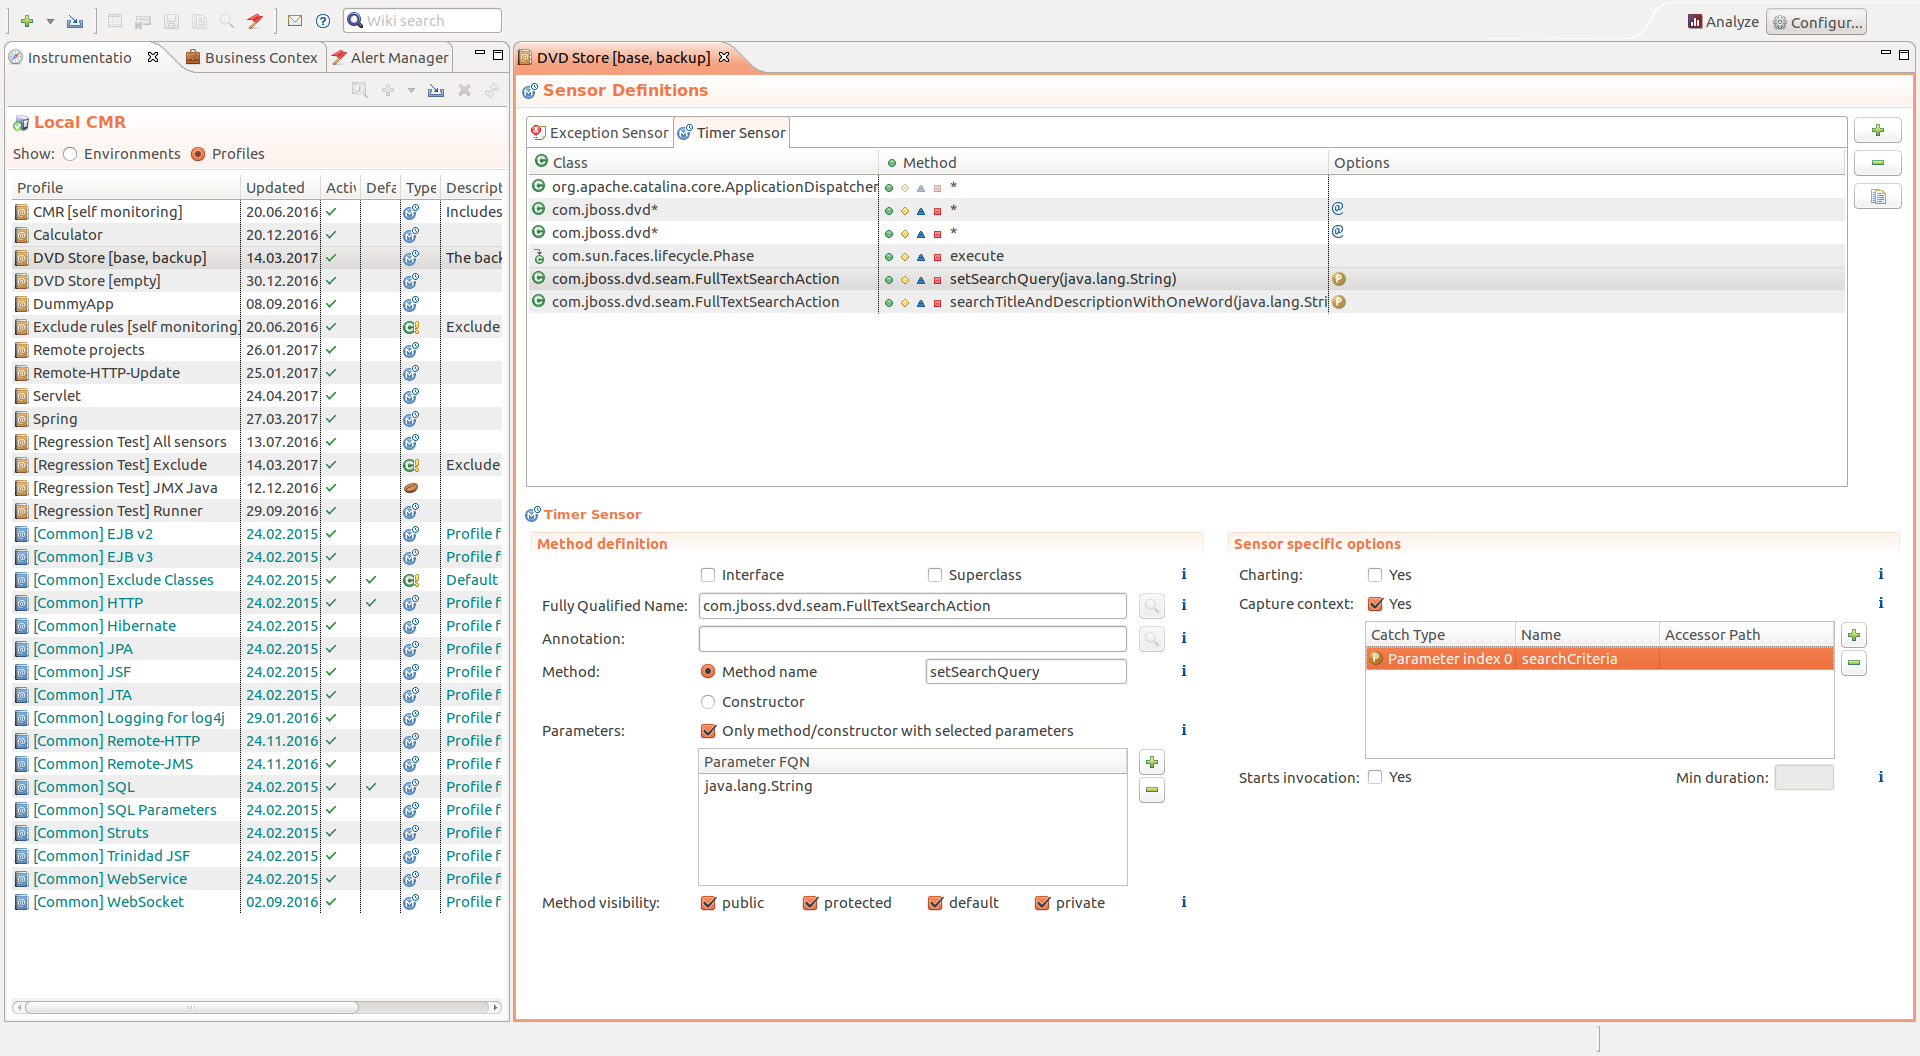
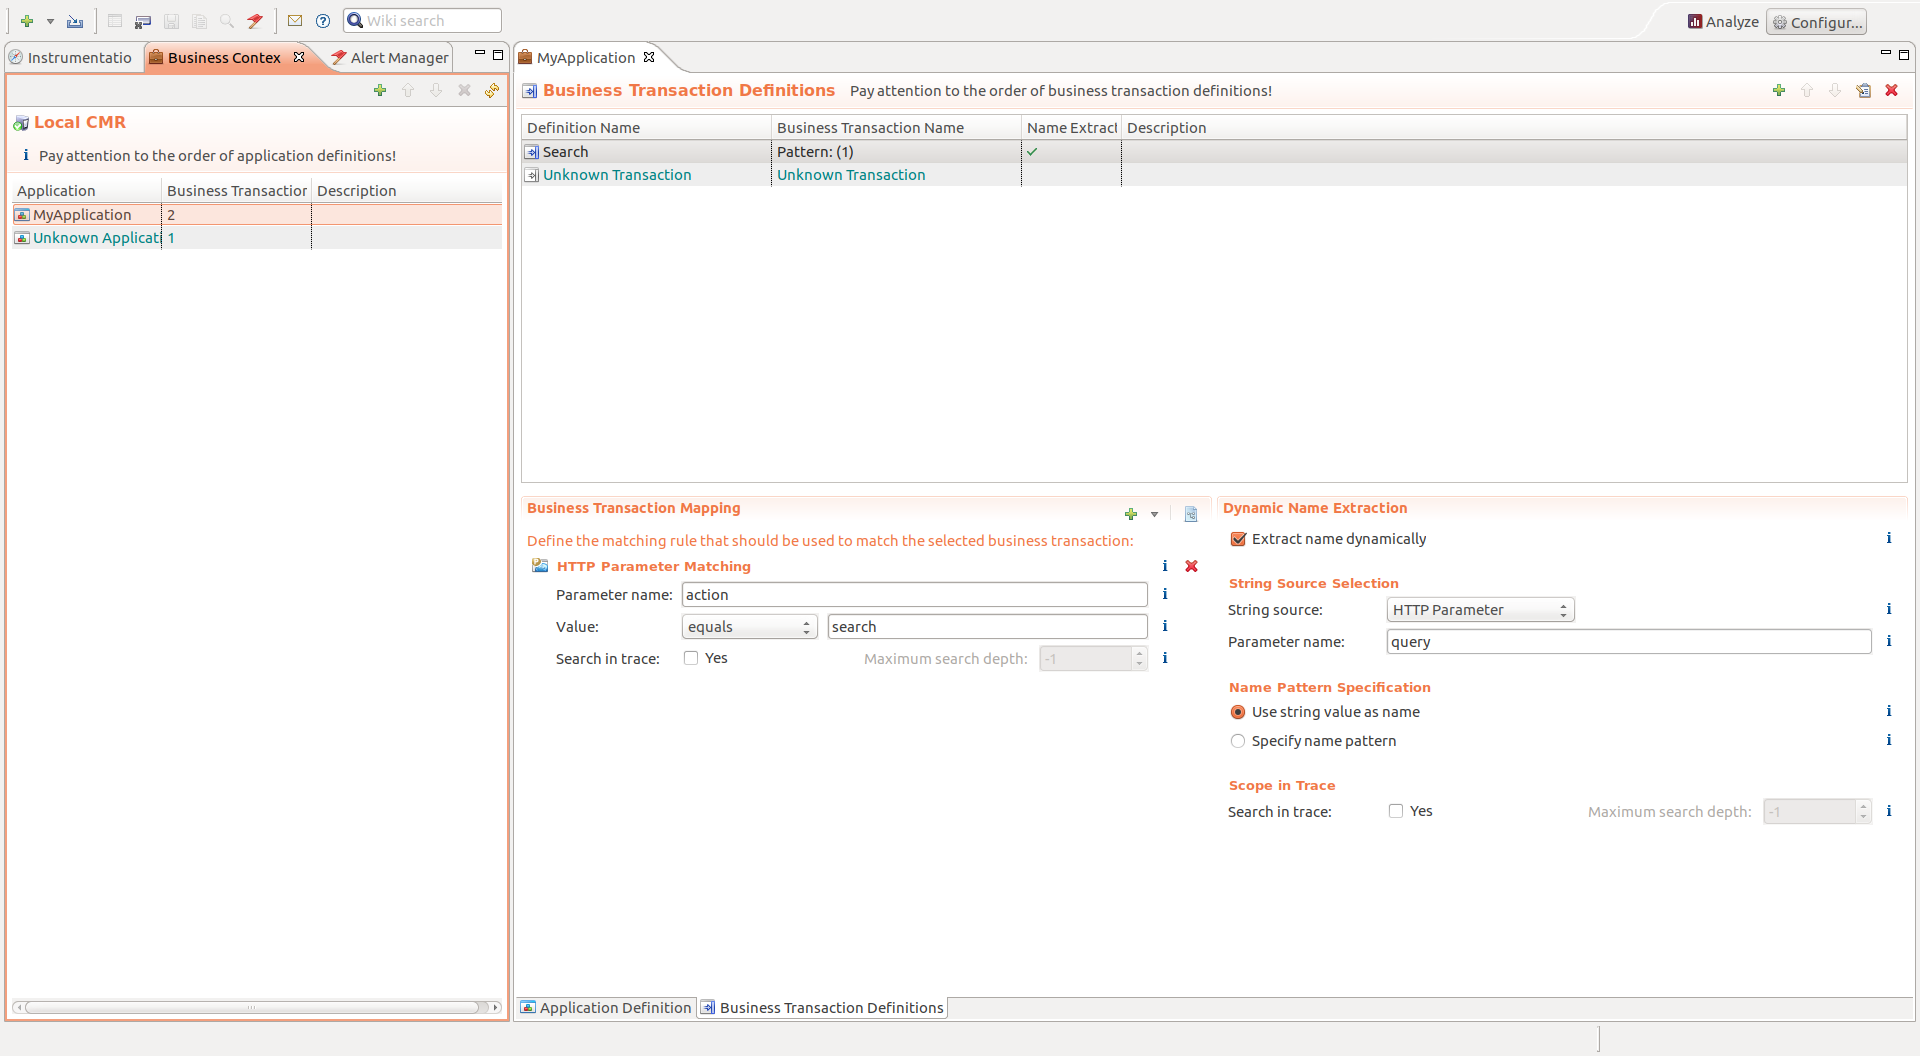
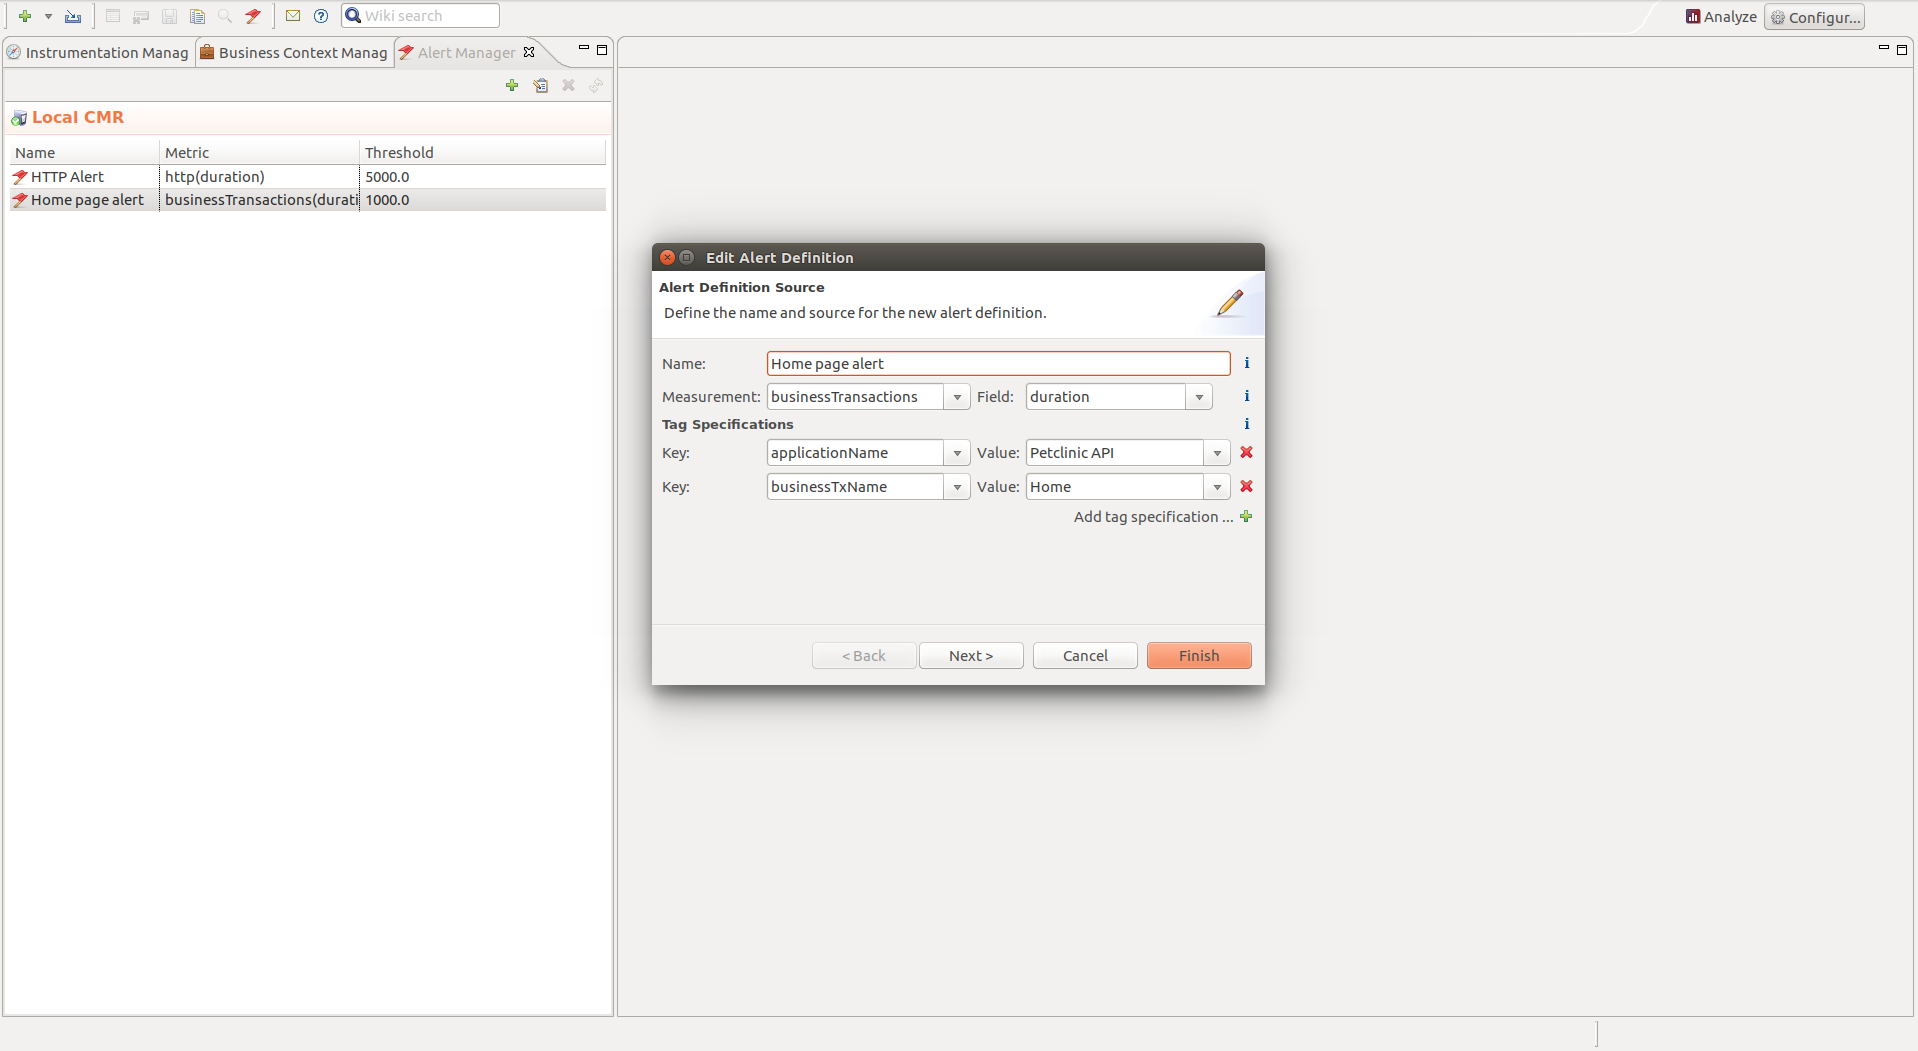
| Details (Exceptions) | Sensor configuration | Business context | Alerting |
| --- | --- | --- | --- |
|  |
|  |
|  |
|  |
|
| Monitoring dashboards | EUM Summary | EUM Single Page | EUM 3rd Party Content |
| --- | --- | --- | --- |
| 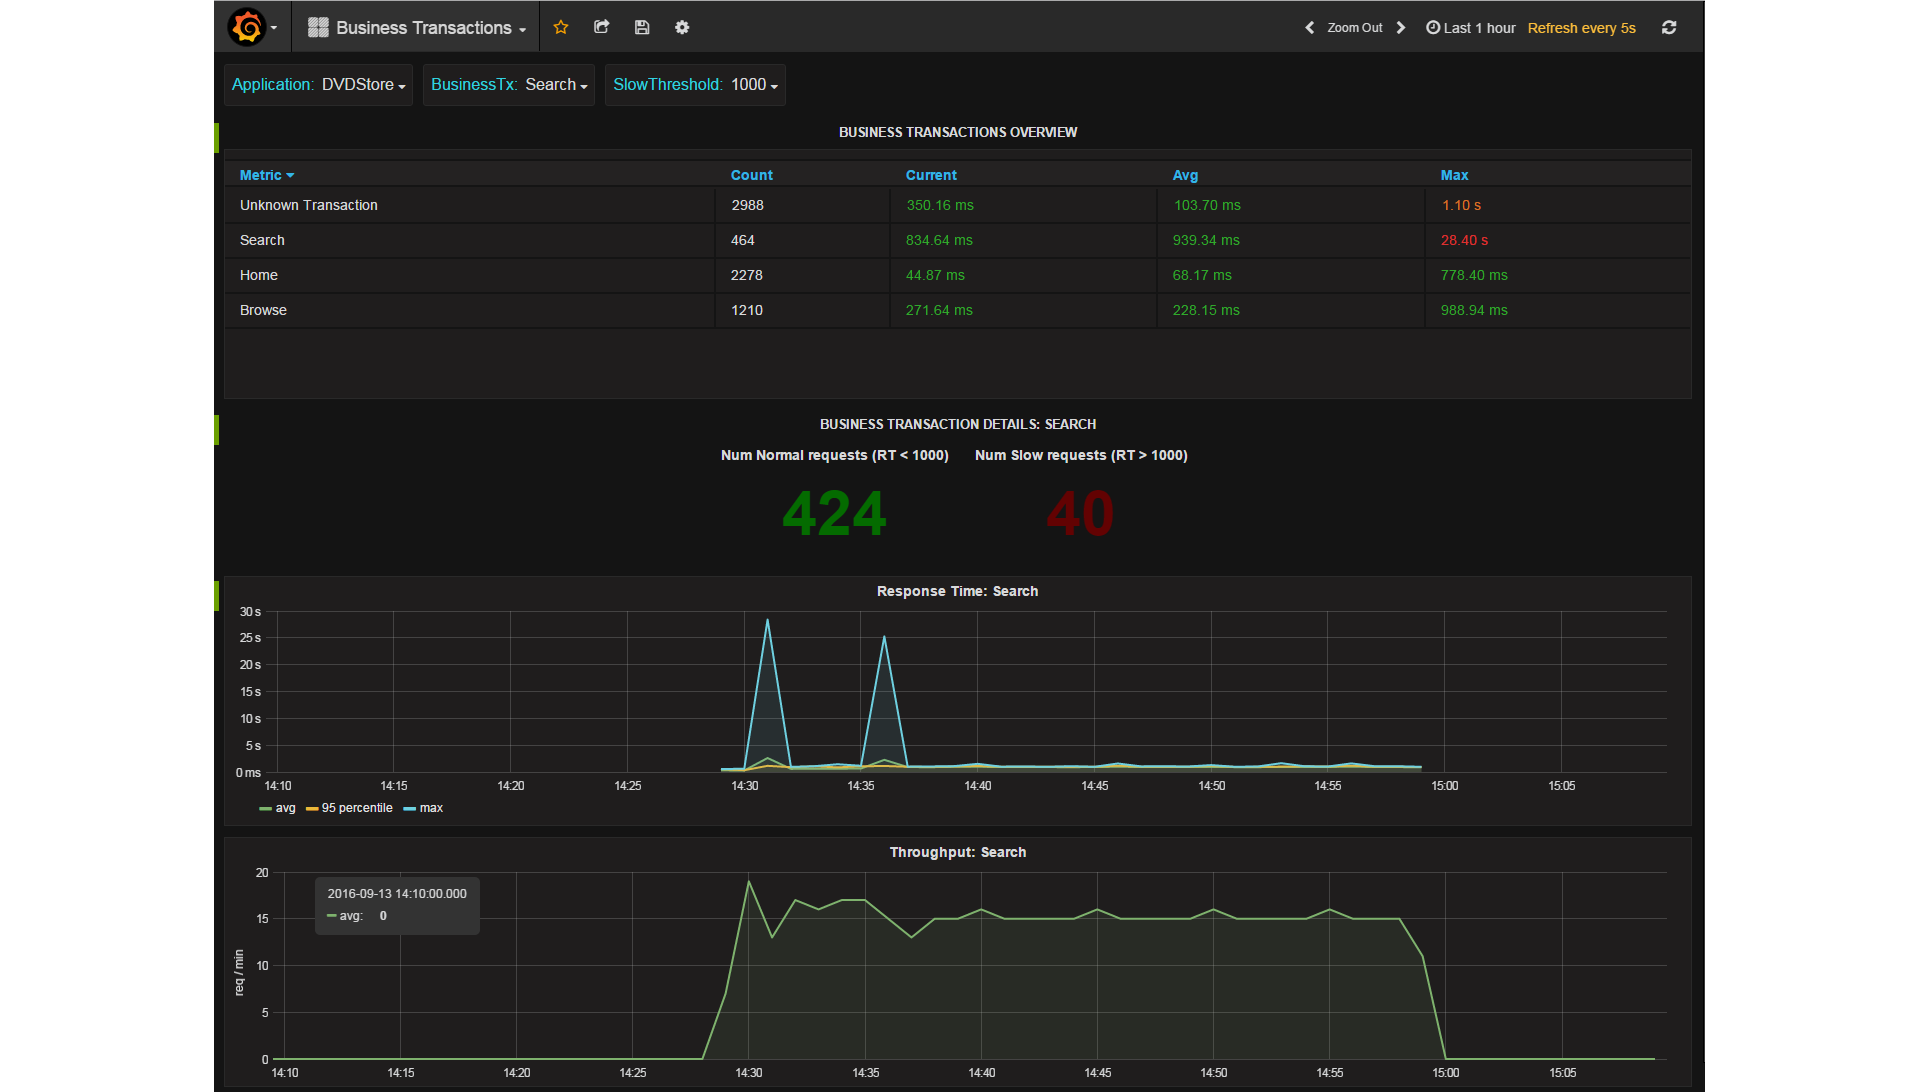 |
| 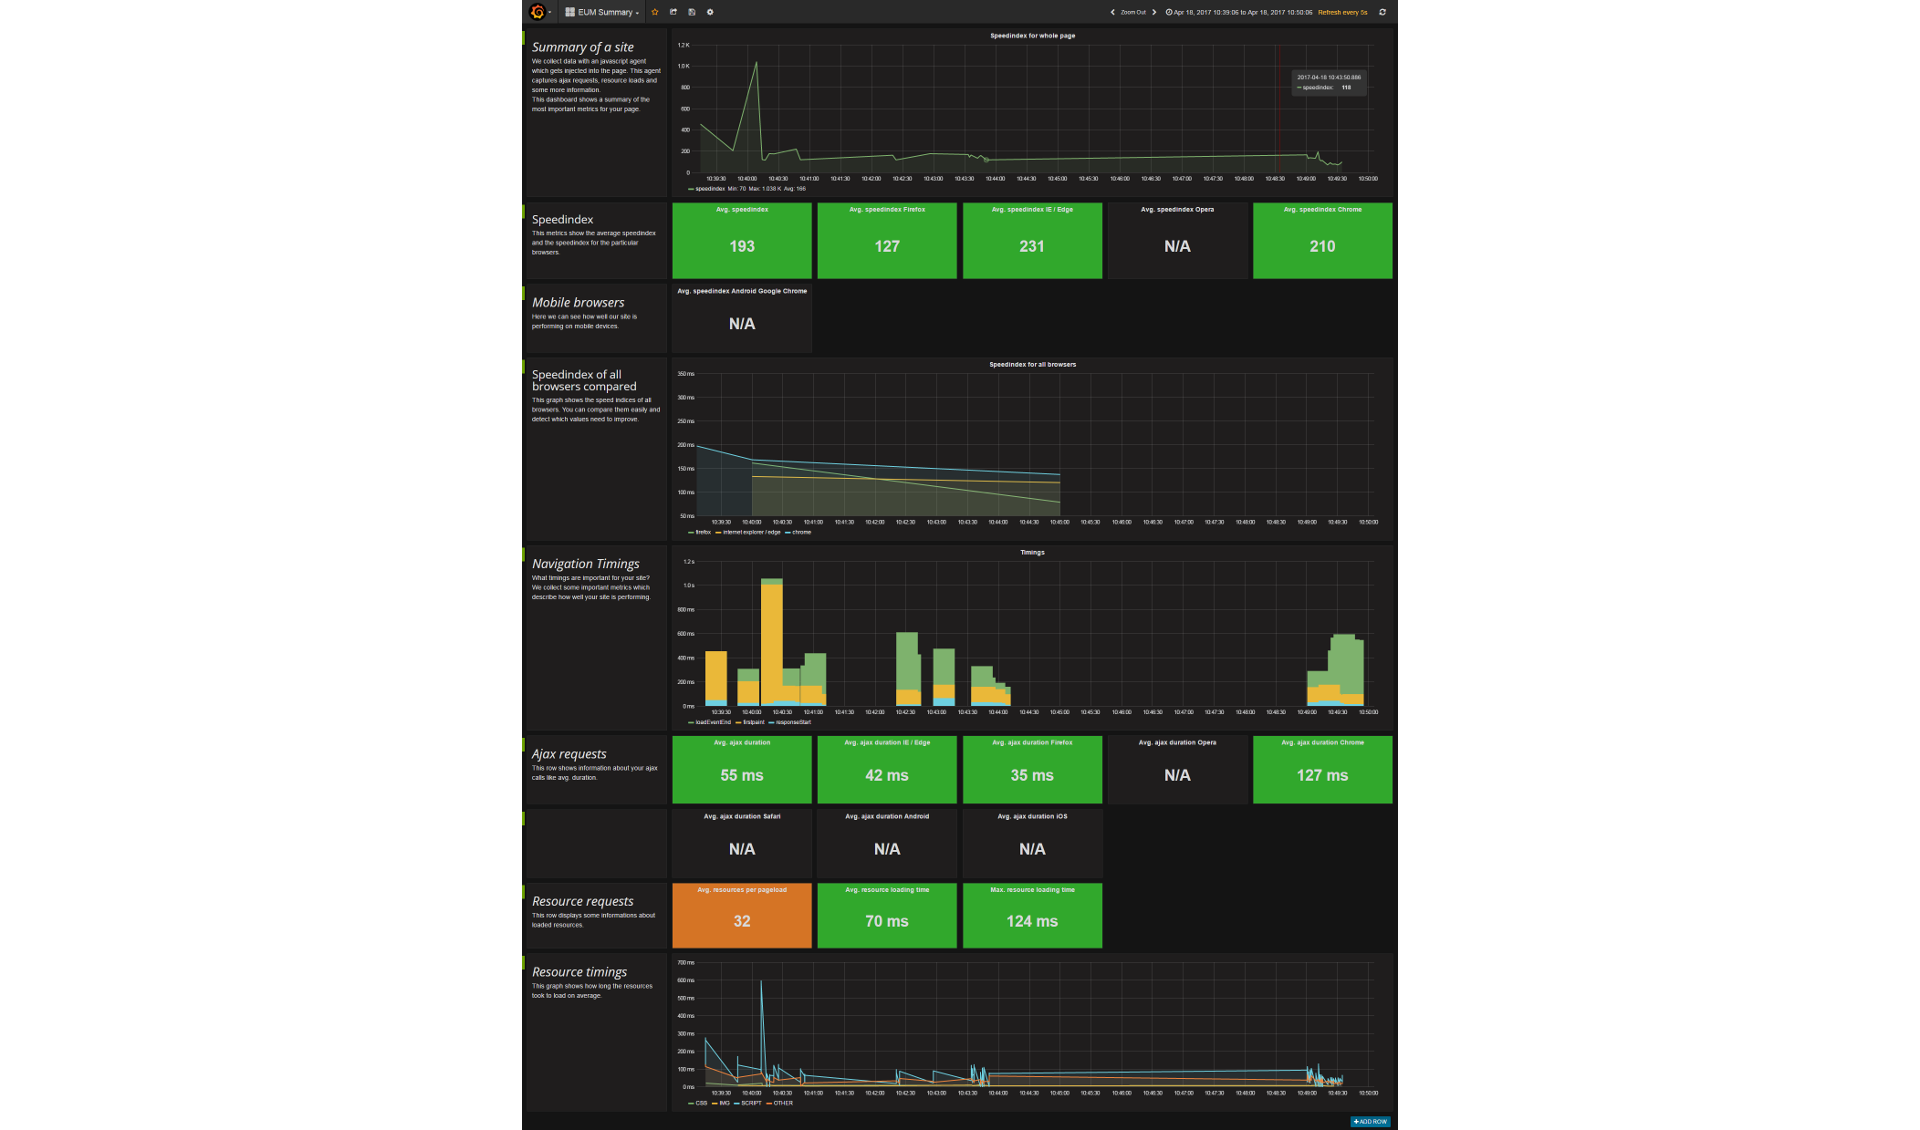 |
| 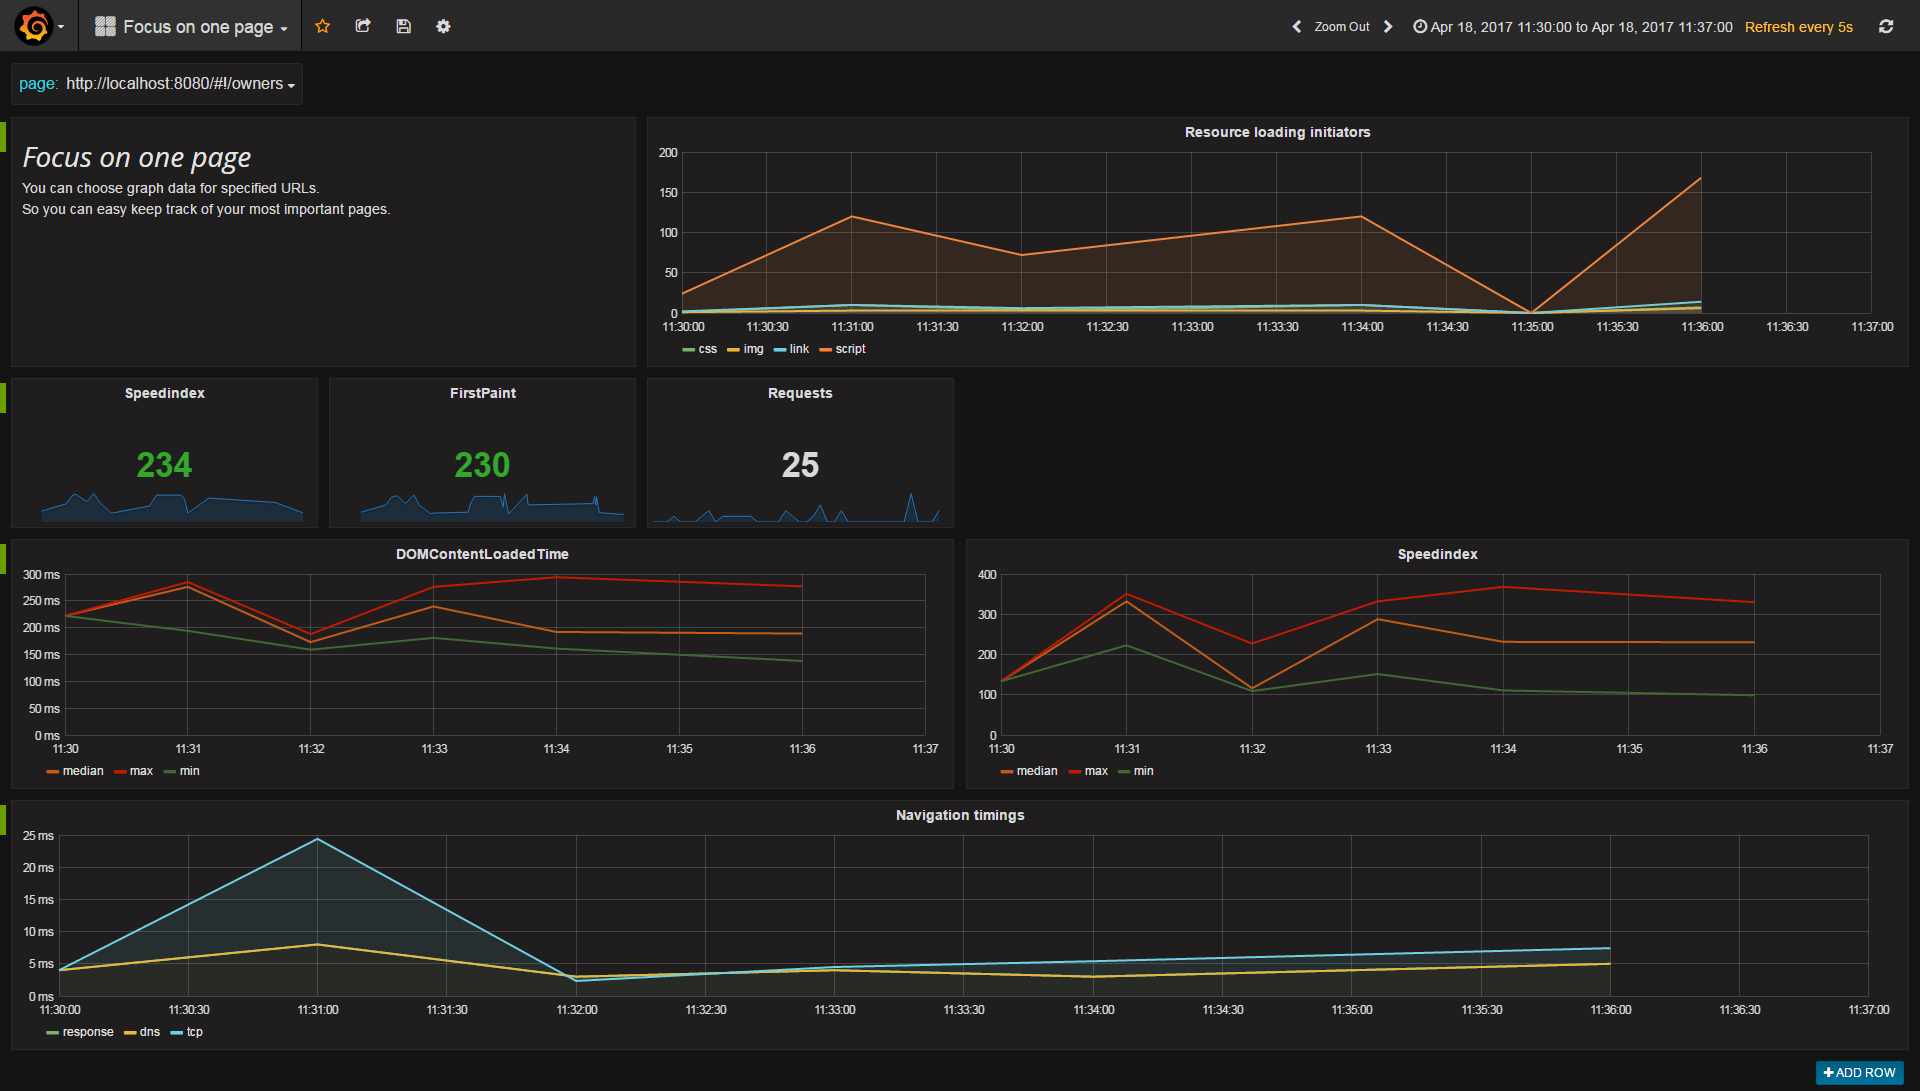 |
| 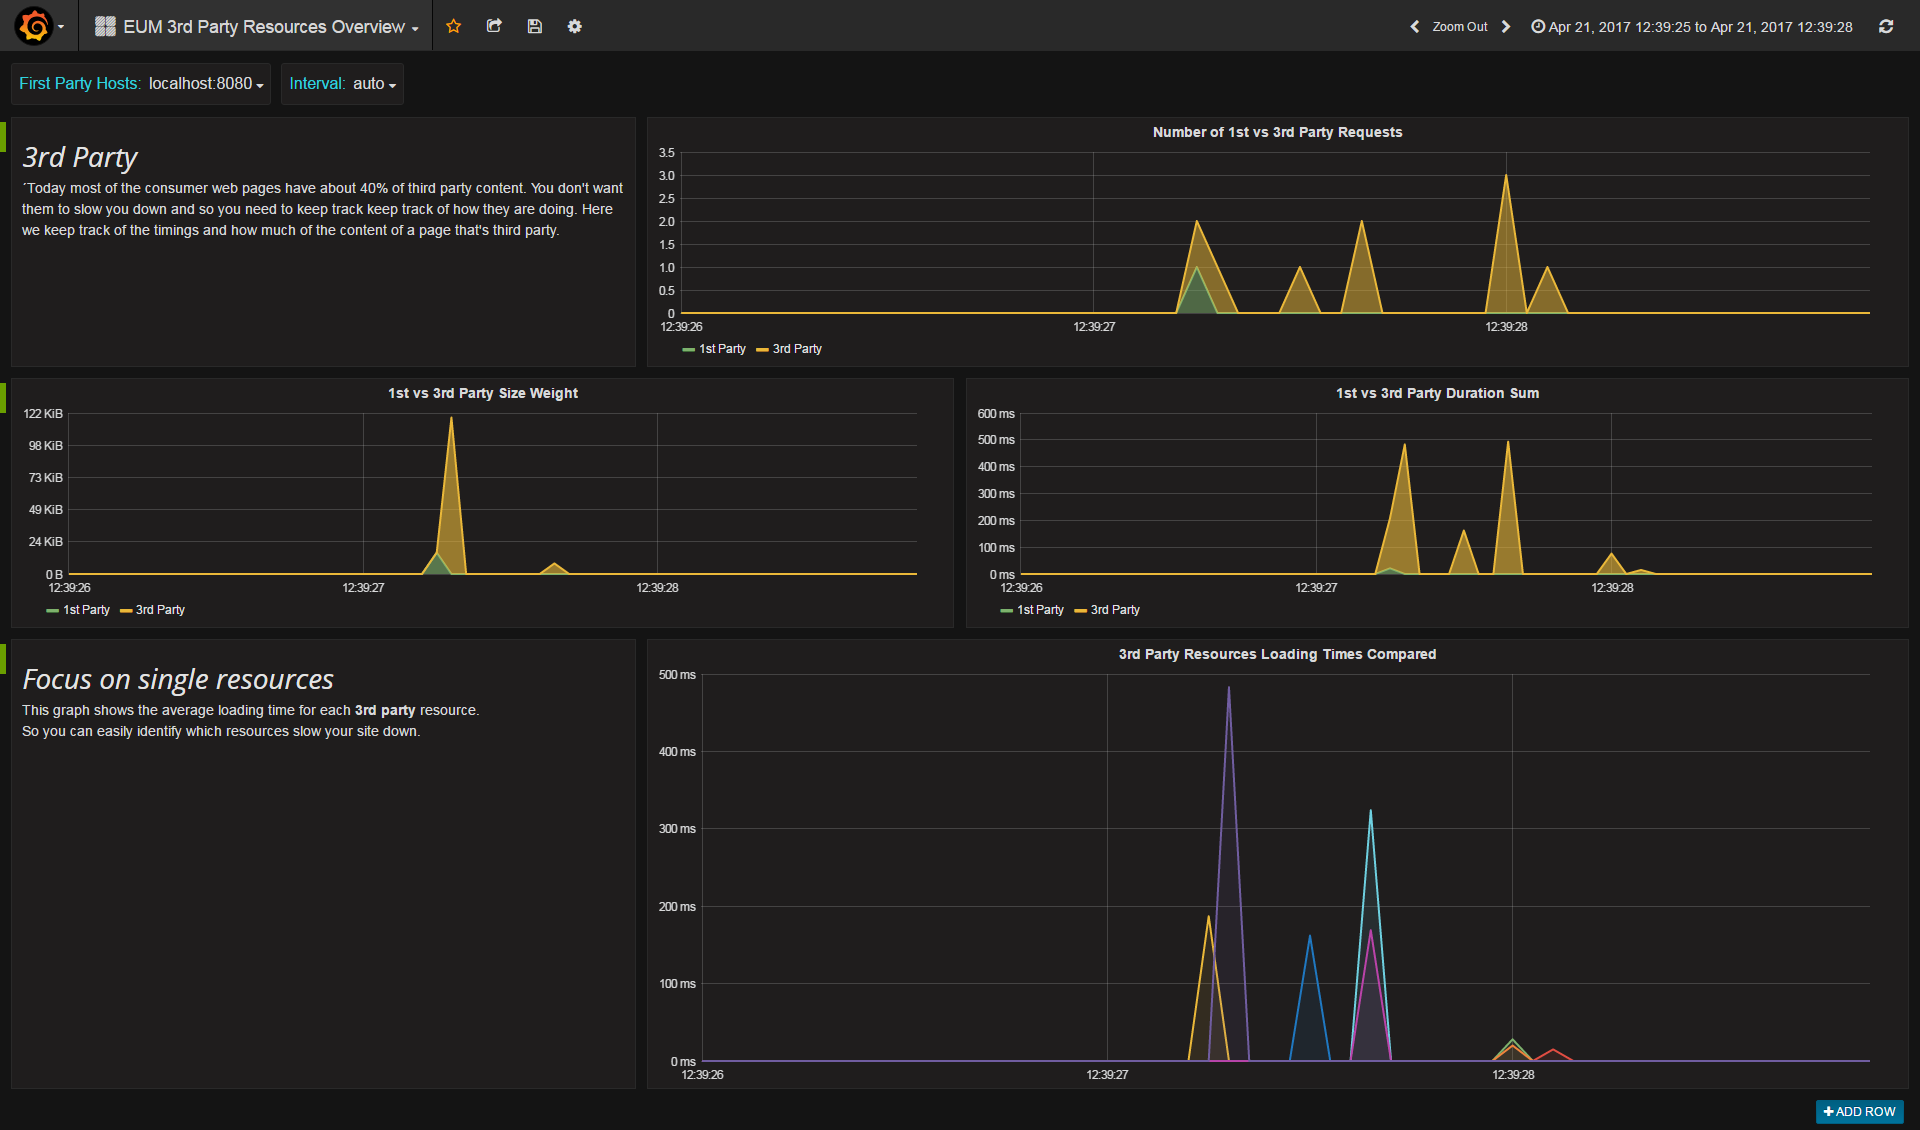 |
|
- Browser End User Monitoring: automatic injection of a JavaScript agent into your application HTML code.
- Trace Based
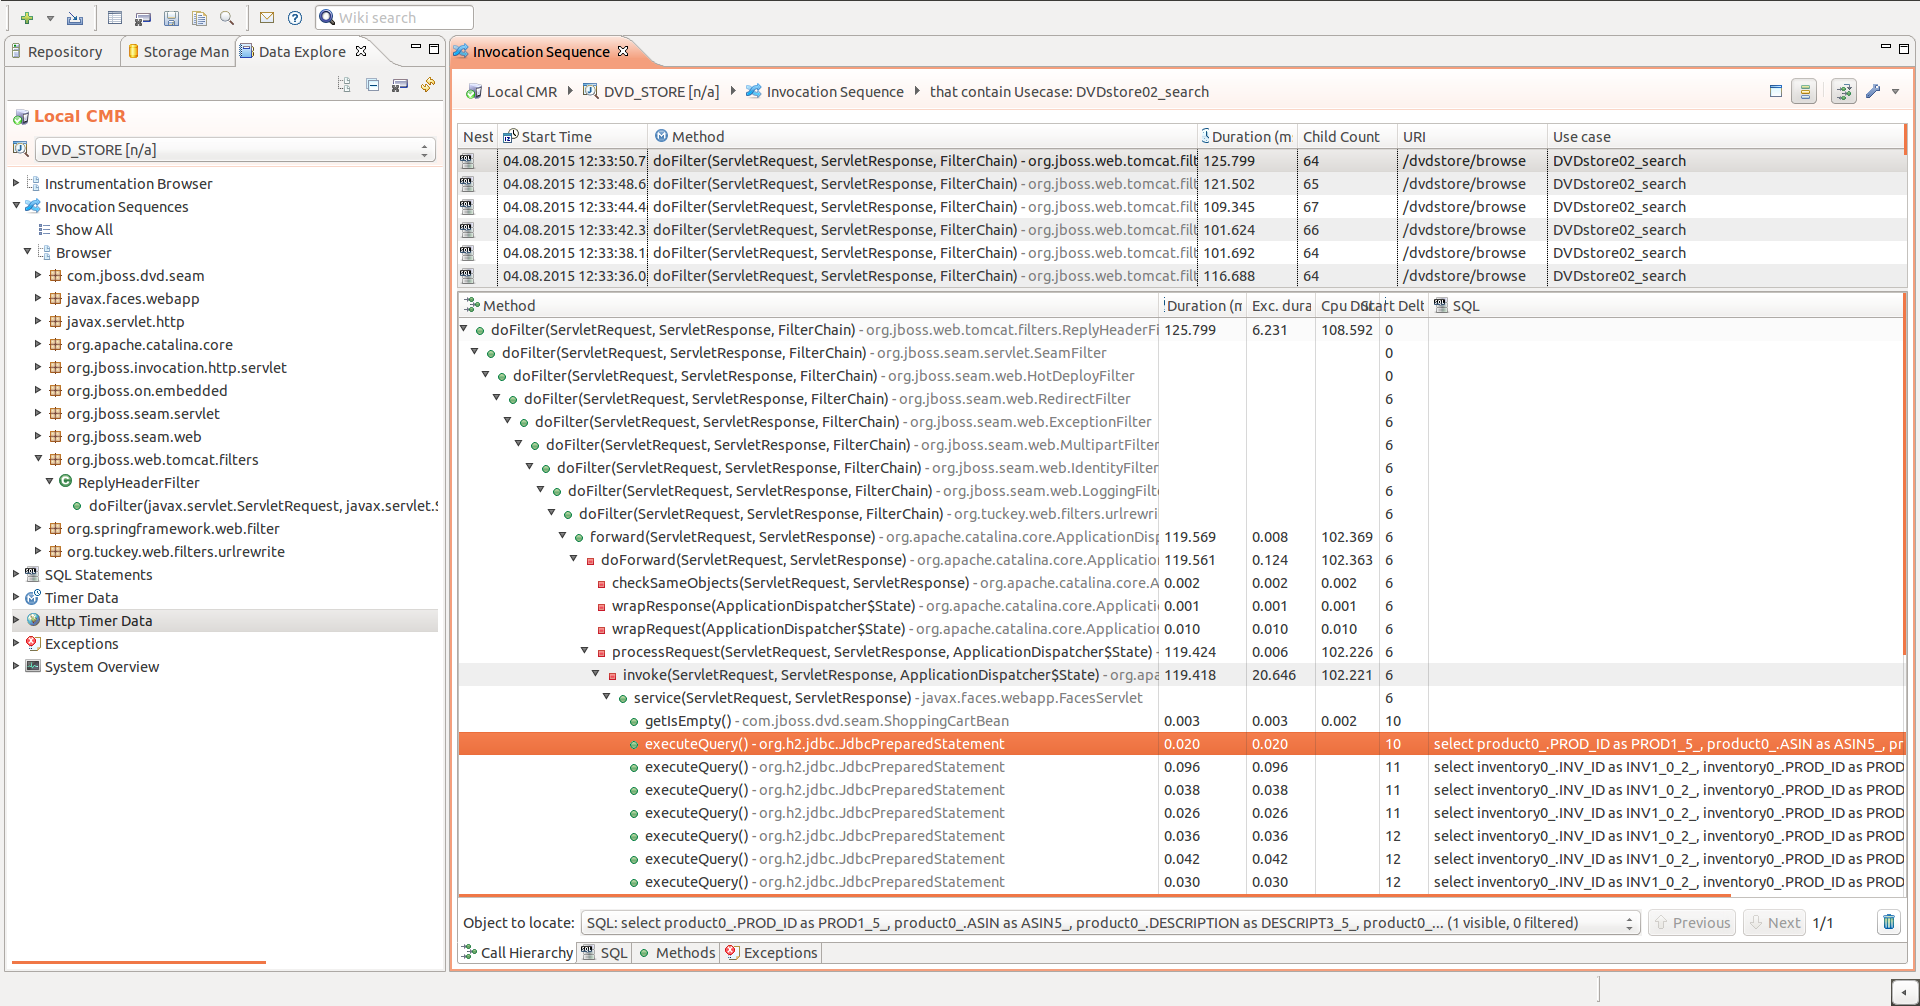
- Detailed trace representation (invocation sequence) for every request containing all interactions with the systems.
- Support for inter-JVM communication based on HTTP and JMS: each trace shows interaction with all correlated JVMs.
- Support for browser-JVM communication: correlation between user actions in the browser and backend requests.
- SDK which implements the OpenTracing.io API. All user spans are combined with inspectIT measurements in a single trace.
- Variety of Information
- Automatic enrichment of every trace with HTTP information, SQL queries, exceptions, parameters and many more.
- Detailed exception capturing allows to analyze functional problems.
- Drill down into one invocation sequence to find and analyze problematic requests.
- Drill up from an problem within an invocation sequence and find business-related information like the URL the request was sent to.
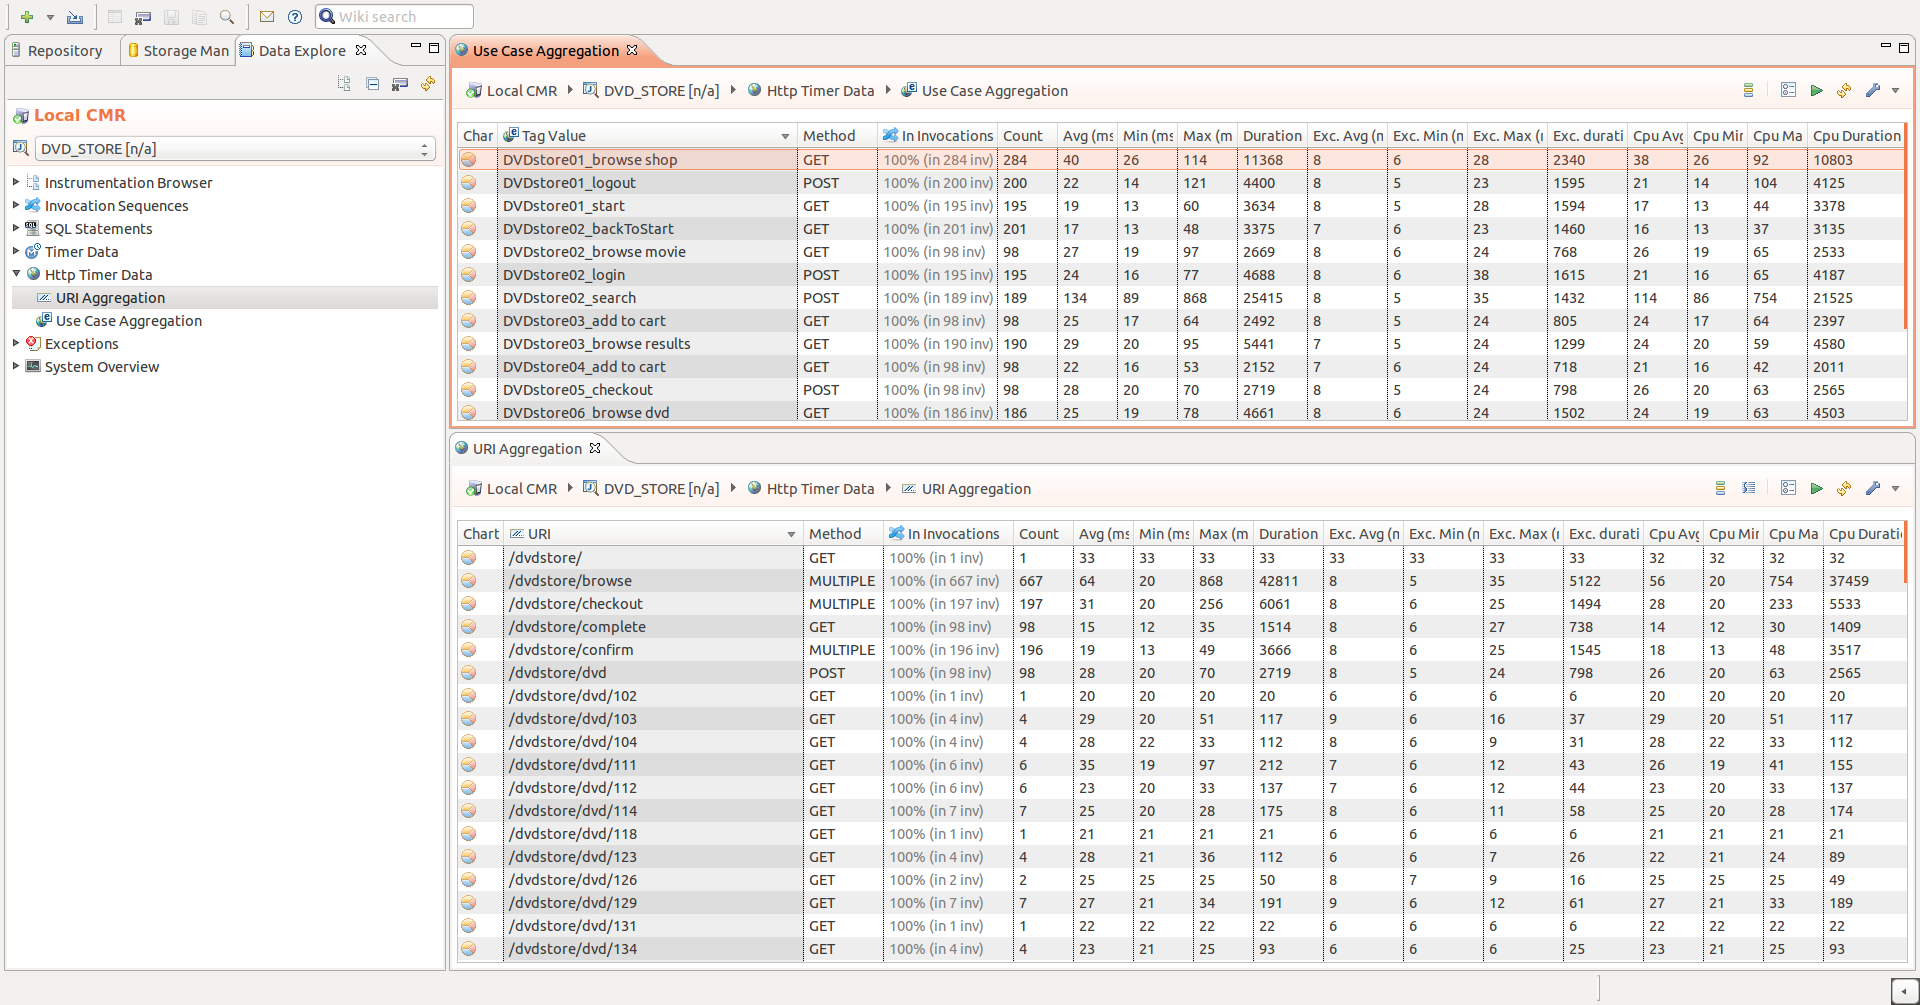
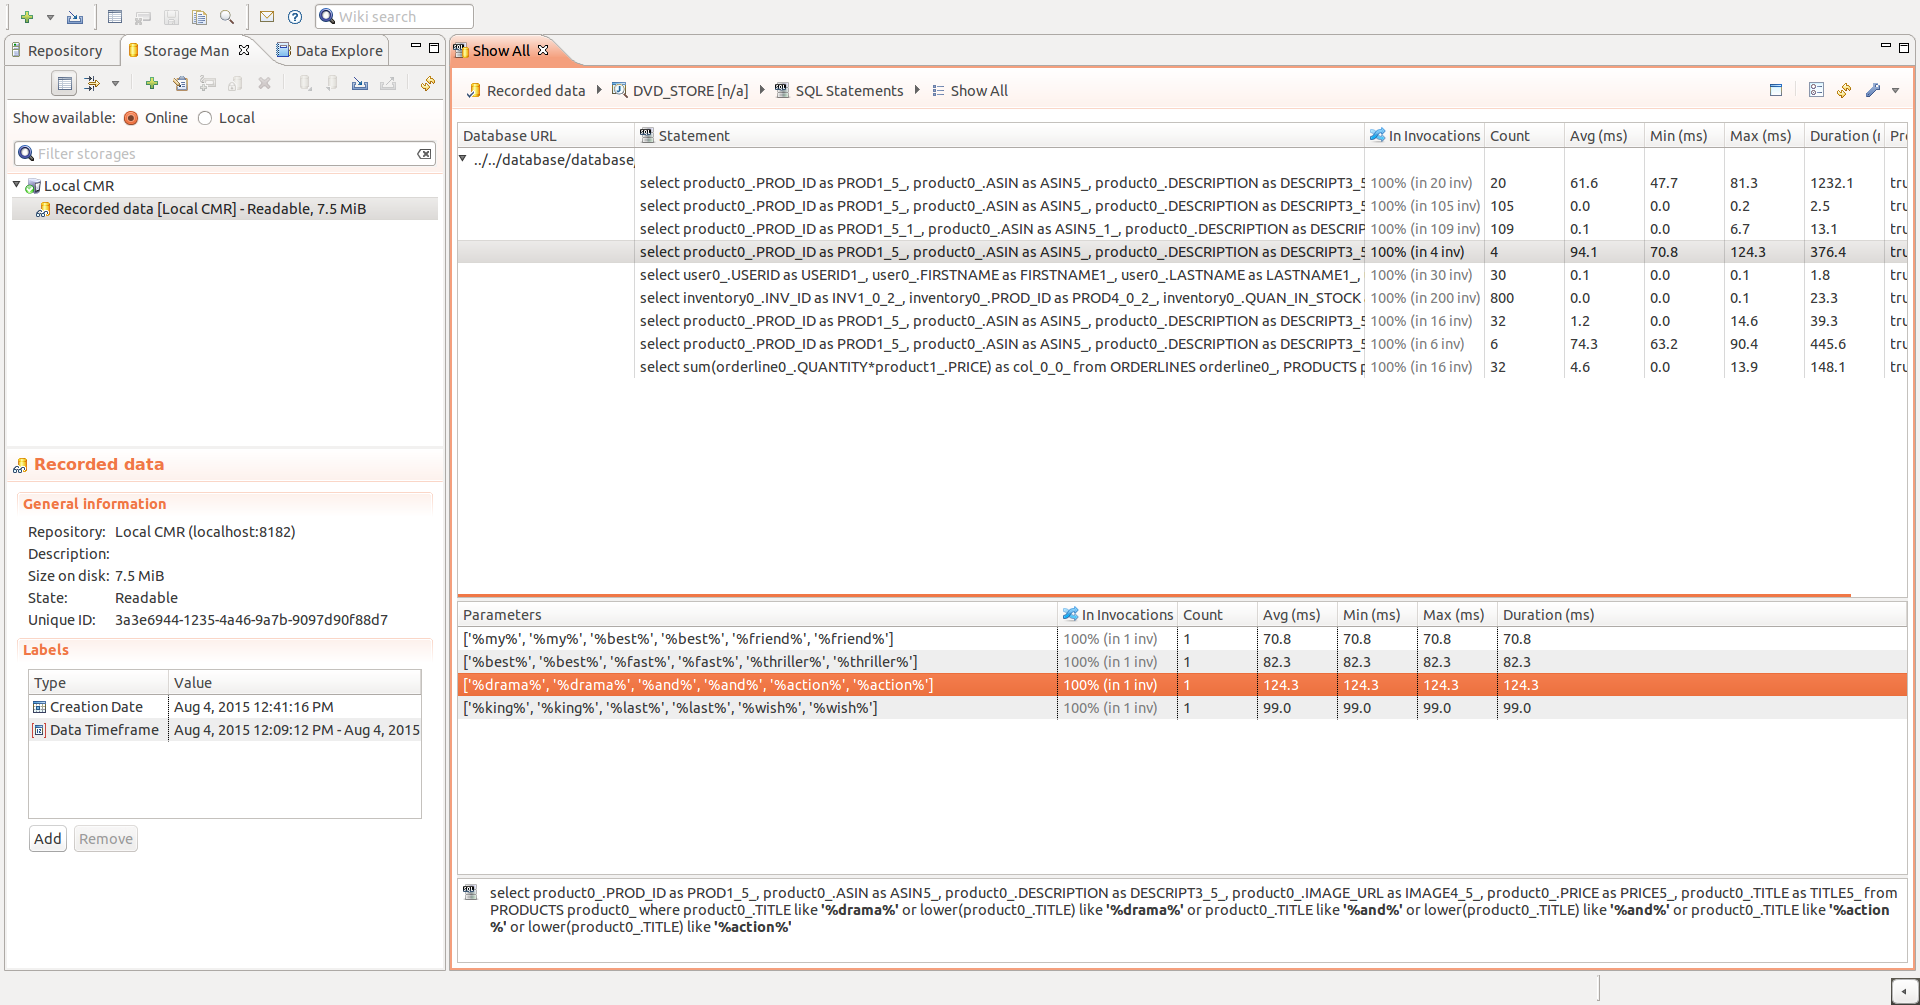
- Aggregated views for every captured metric, e.g. aggregated SQL overview shows metrics aggregated by SQL query.
- Business Context
- Have a view on your application's business transactions by using flexible business context definitions.
- Monitor and analyze requests by the functional use-case.
- Monitoring
- Monitor your hardware metrics like cpu, memory or threads.
- Monitor metrics exposed via JMX beans.
- Integration with influxDB and Grafana for easy monitoring with pre-defined dashboards.
- Simple e-mail alerting is possible on all long-term monitoring data.
- Diagnosis Service for automatic performance problem detection.
- RESTful API for automation and integration with other tools.
- Usability at Its Best
- Easy and transparent integration of the inspectIT agent in your application (compatible with Java 6, 7, 8, and 9).
- Out-of-the-box profiles for a quick start.
- Dynamic instrumentation - change measurement points on the monitored JVM without a need for restart.
- Store, import and export detailed traces with all information instead of noting down which user-clicks led to a problem.
- No more config-files! We have fully adaptable, graphical configuration interfaces for everything.
- Optimized for Low Overhead
- Production-proof: Used for >8 years at our customers and during performance firefights.
- One server is enough for most environments supporting a medium number of agents.
- Extendable system: Missing something? Write your own extensions.
End User Monitoring
<sup>:warning: We recommend to try this feature on a system configuration in a safe environment first.</sup>
The inspectIT 1.8 line comes with a new feature: Browser End User Experience Monitoring (EUM). This feature allows you to measure the performance at the browser side of the end user, giving more detailed insights than the back-end instrumentation alone. This is done by automatically injecting a JavaScript agent into your applications HTML code, which in turn captures relevant metrics at the client-side and sends them back to inspectIT using AJAX Requests. Check the official feature documentation to help you started.
Tracing
![]()
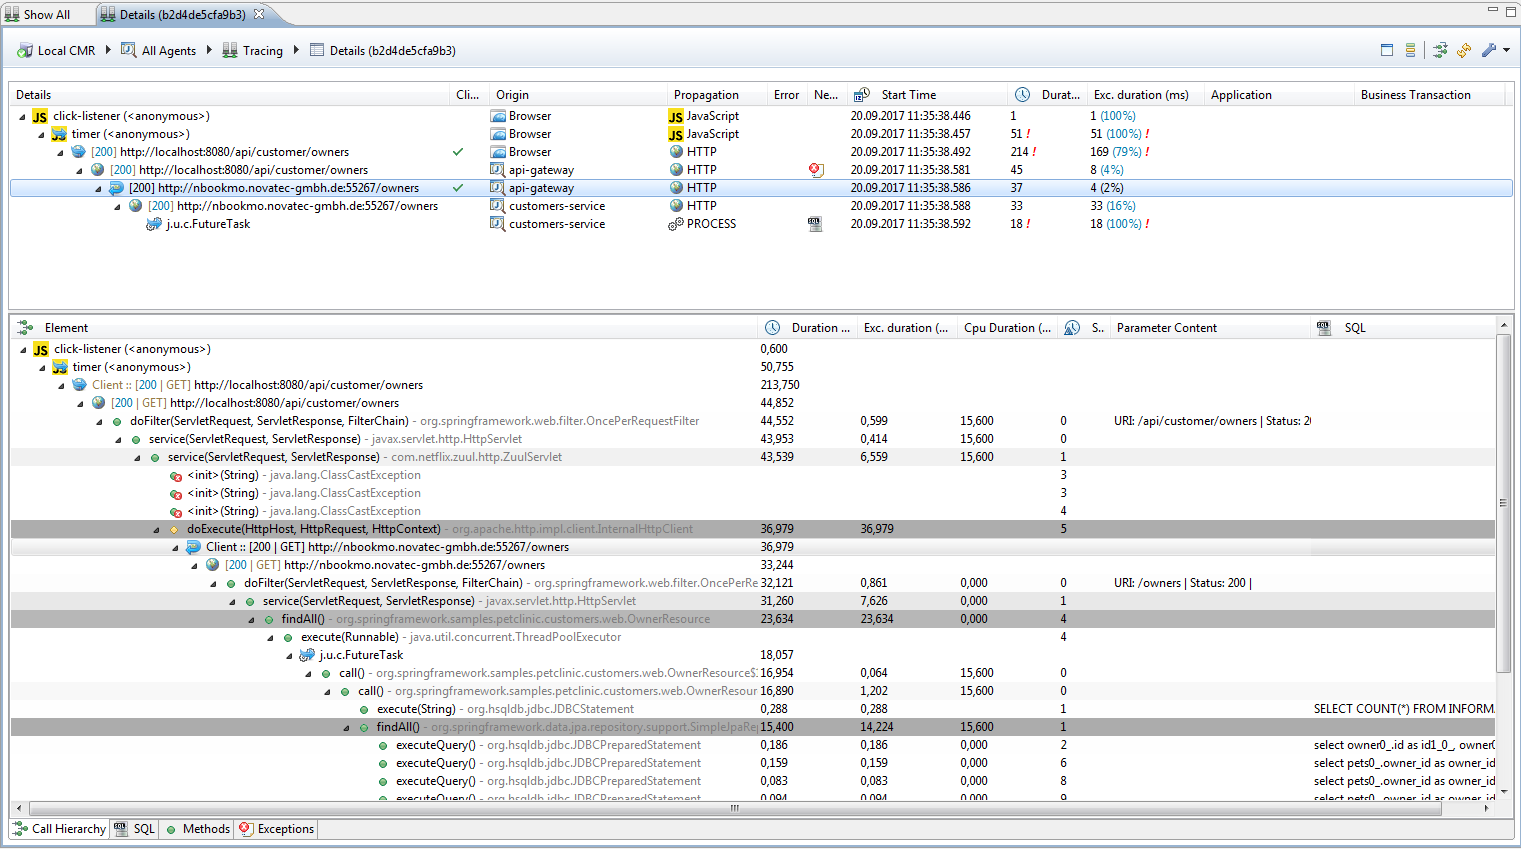
inspectIT provides a set of remote sensors in order to create traces and correlate calls made between JVM nodes in your application. These traces can provide an end-to-end view on the user request execution, even they are spanning over multiple JVMs. In addition, if end-user-monitoring is active inspectIT is capable of correlating browser side actions, like page loads or clicks, to resulting back-end requests (screenshot).
The remote tracing is done in inspectIT as per OpenTracing.io specification, with a similar data model based on spans. Furthermore, inspectIT combines the captured spans with the invocation sequences created on each JVM and, thus, is able to provide not only the landscape of the interacting JVMs but also provide detailed information on the invocation execution during complete traces. This includes all the data that is captured as a part of invocation sequence, SQL statements, exceptions, method calls, etc. Visit the official feature documentation to help you get started.
With a set of default inspectIT profiles you get automatic tracing for following technologies and libraries without a need to change your source code nor dependencies. Currently, we support:
- Java
- Executor service (Java 6+)
- HTTP
- Apache HttpComponents Async Client (version 4.x)
- Apache HttpComponents Client (version 4.x)
- Java Servlet API (version 2.x & up)
- Java URL Connection (Java 6+)
- Jetty Http Client (versions 7.x & 8.x)
- Spring Rest Template (version 3.x & 4.x)
- JMS
- Java Message Service API (version 1.x & up)
The OpenTracing.io API implementation is provided as a part of inspectIT's inspectit.agent.java.sdk project. Users of the OpenTracing.io API can easily use inspectIT as the implementation.
Automatic Performance Problems Detection
<sup>:warning: Experimental</sup>
As s result of the diagnoseIT research project, inspectIT's version line 1.8 offers an integrated diagnosis service for automatic performance problems detection. This service can analyze requests lasting longer than a user-defined baseline and provides insights on where the performance problems can be. An overview of found problems is provided as a part of the monitoring dashboards. Vis
