Storyboard
End-to-end, hierarchical, real-time, colorful logs and stories
Install / Use
/learn @guigrpa/StoryboardREADME
Storyboard 
A library, plus a Chrome DevTools extension.
Blog post: http://guigrpa.github.io/2016/07/18/untangling-spaghetti-logs/
These docs are for Storyboard v3. Docs for v2 are also available, but you're encouraged to upgrade!
Why? :sparkles:
- Hierarchical stories: put logs in context (stories), and group them in higher-order stories; they can be a life-saver with concurrent user actions and async events.
- End-to-end stories: see all client and server tasks triggered by a user action (a click on the Login button, maybe) in a single place.
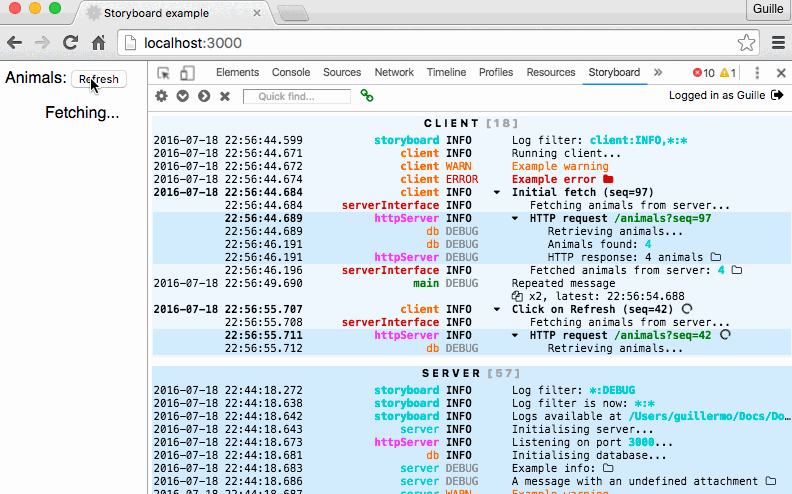
- Storyboard DevTools Chrome extension: view client and server logs with a clean and detail-rich interface, including advanced features such as remote monitoring (for mobile devices and non-Chrome browsers) and relative timestamps.
- Storyboard CLI: wrap any application with it (no changes required) to monitor it remotely with the Storyboard DevTools.
- Real-time push of server logs to the Storyboard DevTools extension via WebSockets, with opt-in client-server clock synchronization. Even more: control the level of detail you get from various parts of your server remotely, without relaunching.
- Secure server logs: remote access is opt-in, and can be authenticated.
- Attach anything to your logs for further investigation.
- Plug-in architecture. Available plugins include Console (& Parallel Console), WebSocket Server & Client, File, (PostgreSQL) Database, and Browser Extension, but you can write your own too!
- Lightweight. Plugins are now (v3) available separately, so you only need to bring in the dependencies you actually use.
- Rich filter options: give logs source and severity attributes and apply fine-grained filtering, with white and black lists.
- Colorful: use color to convey meaning and importance. Storyboard extends the popular chalk library so that it can also be used on the browser.
- Enjoy the simple-yet-powerful API.
- Flow-compatible (with zero config).
Installation
For the simplest possible Storyboard installation (for more options, check out the Listeners section below):
$ npm install --save storyboard storyboard-preset-console
If you only want the (less powerful) CLI tool, see this section.
To install the Storyboard DevTools Chrome extension, get it from the Chrome Web Store. Optional, but highly recommended! After installing it, open the Storyboard pane in the Chrome DevTools and point your browser to a Storyboard-equipped page (see below for how to use the library).
CLI tool
Hopefully the next sections will convince you of the benefits of adding Storyboard to your project. If you don't want to modify your existing application but still want to use the Storyboard DevTools or other Storyboard features, you can use the sb CLI tool:
$ npm install -g storyboard-cli
$ sb --server ls

2016-07-15T17:26:33.974Z           storyboard INFO  ┌── ROOT STORY [CREATED]
2016-07-15T17:26:33.975Z           storyboard INFO  Log filter: *:DEBUG
2016-07-15T17:26:34.151Z           storyboard INFO  Logs available via web on port 8090
2016-07-15T17:26:34.154Z                 main INFO  CHANGELOG.md
2016-07-15T17:26:34.155Z                 main INFO  LICENSE
2016-07-15T17:26:34.155Z                 main INFO  README.md
2016-07-15T17:26:34.155Z                 main INFO  ROADMAP.md
2016-07-15T17:26:34.155Z                 main INFO  chromeExtension
2016-07-15T17:26:34.155Z                 main INFO  coverage
...
You can pipe stdin and stdout in the standard way:
$ sb ls | head -n 3

2016-07-15T14:41:47.573Z           storyboard INFO  ┌── ROOT STORY [CREATED]
2016-07-15T14:41:47.574Z           storyboard INFO  Log filter: *:DEBUG
2016-07-15T14:41:47.601Z                 main INFO  CHANGELOG.md

$ ls | sb -- head -n 3

2016-07-15T14:41:52.174Z           storyboard INFO  ┌── ROOT STORY [CREATED]
2016-07-15T14:41:52.176Z           storyboard INFO  Log filter: *:DEBUG
2016-07-15T14:41:52.201Z                 main INFO  CHANGELOG.md
2016-07-15T14:41:52.201Z                 main INFO  LICENSE
2016-07-15T14:41:52.201Z                 main INFO  README.md
2016-07-15T14:41:52.202Z                 main INFO
2016-07-15T14:41:52.203Z           storyboard INFO  └── ROOT STORY [CLOSED]
Note the use of the -- separator: options before the separator are passed to the sb tool; after the separator, they are passed to the called application.
Here are the CLI tool configuration options:
$ sb --help

  Usage: sb [options] <command> [args...]

  Options:

    -h, --help         output usage information
    -V, --version      output the version number
    --no-console       Disable console output
    --stderr           Enable stderr for errors
    --no-colors        Disable color output
    -f, --file <path>  Save logs to file
    -s, --server       Launch web server for logs
    -p, --port <port>  Port for web server
Storyboard library usage
Basic usage
import { mainStory } from 'storyboard';
import 'storyboard-preset-console';

mainStory.info('Hello world!');
We're using the storyboard-preset-console preset for convenience, which is equivalent to:
import { mainStory, addListener } from 'storyboard';
import consoleListener from 'storyboard-listener-console';
addListener(consoleListener);

mainStory.info('Hello world!');
See more details on plugins in Listeners below.
Severity levels
mainStory.trace('Teeny-weeny detail: x = 3, y = 4');
mainStory.debug('Called login()');
mainStory.info('User "admin" authenticated successfully');
mainStory.warn('Sad we can\'t show colors in GFM');
mainStory.error('User "admin" could not be authenticated', { attach: err });
mainStory.fatal('Ooops! Crashed! Mayday!', { attach: fatalError });
// ...
// 2016-03-09T16:18:19.659Z           main WARN  Sad we can't show colors in GFM
// 2016-03-09T16:18:19.672Z           main ERROR User "admin" could not be authenticated
// 2016-03-09T16:18:19.672Z           main ERROR   name: 'Error'
// 2016-03-09T16:18:19.672Z           main ERROR   message: 'AUTHENTICATION_ERROR'
// 2016-03-09T16:18:19.672Z           main ERROR   stack: Error: AUTHENTICATION_ERROR
// 2016-03-09T16:18:19.672Z           main ERROR   stack:     at repl:3:11
// ...
Maybe you noticed that the trace call produces no output by default. See Log filtering to fine-tune your filters.
Sources
Namespace your logs for readability, as well as to allow finer-grained filtering later on.
mainStory.info('http', 'GET /api/item/25');
mainStory.info('db', 'Fetching item 25...');
// 2016-03-09T16:29:51.943Z           http INFO  GET /api/item/25
// 2016-03-09T16:31:52.231Z             db INFO  Fetching item 25...
Colors
Use colors to emphasize/de-emphasize parts of your logs:
import { mainStory, chalk } from 'storyboard';
mainStory.info('http', `GET ${chalk.green.bold('/api/item/26')}`);
mainStory.info('db', `Fetching item ${chalk.green.bold('26')}...`);
// 2016-03-09T16:29:51.943Z           http INFO  GET /api/item/26
// 2016-03-09T16:31:52.231Z             db INFO  Fetching item 26...
As seen above, we recommend using the popular chalk library by Sindre Sorhus. Chalk is automatically extended by Storyboard for use in the browser. If you prefer another ANSI-color library, make sure it's universal and doesn't disable itself automatically in the browser.
Attachments
Attach anything to your logs that might provide additional context: an object, an array, an exception, a simple value... Don't worry about circular references, long buffers, or undefined! Use the attach option to display it as a tree, or attachInline for a more compact, JSON.stringify-ed version.
You can also use the attachLevel option to control the (severity) level of the detailed object logs (by default: the same level of the main logged line). Pro tip: use the trace level for long attachments (hidden by default), so that they don't pollute your console but are still accessible via the Storyboard DevTools extension.
mainStory.info('test', 'A simple object', { attachInline: obj1 });
// 2016-03-09T16:51:16.436Z           test INFO  A simple object -- {"foo":2,"bar":3}
mainStory.info('test', 'An object with a circular reference', {
  attach: obj2,
  attachLevel: 'debug',
});
// 2016-03-09T16:52:48.882Z           test INFO  An object with a circular reference
// 2016-03-09T16:52:48.882Z           test DEBUG   foo: 2
// 2016-03-09T16:52:48.882Z           test DEBUG   bar: 3
// 2016-03-09T16:52:48.882Z           test DEBUG   circularRef: [CIRCULAR]
mainStory.info('test', 'This message is logged', {
  attach: butThisHugeObjectIsNot,
  attachLevel: 'trace',
});
// 2017-02-17T16:03:23.124Z           test INFO  This message is logged
// [attachment is hidden; inspect it in the Storyboard DevTools]
Note: attach and attachInline have no effect on the way attachments are shown in the Storyboard DevTools.
Log filtering
Inspired by the popular debug library, Storyboard allows you to filter
Related Skills
node-connect
333.7kDiagnose OpenClaw node connection and pairing failures for Android, iOS, and macOS companion apps
frontend-design
82.0kCreate distinctive, production-grade frontend interfaces with high design quality. Use this skill when the user asks to build web components, pages, or applications. Generates creative, polished code that avoids generic AI aesthetics.
openai-whisper-api
333.7kTranscribe audio via OpenAI Audio Transcriptions API (Whisper).
commit-push-pr
82.0kCommit, push, and open a PR
