Emerge
Emerge is a browser-based interactive codebase and dependency visualization tool for many different programming languages. It supports some basic code quality and graph metrics and provides a simple and intuitive way to explore and analyze a codebase by using graph structures.
Install / Use
/learn @glato/EmergeREADME
Emerge


Emerge (or emerge-viz) is an interactive code analysis tool to gather insights about source code structure, metrics, dependencies and complexity of software projects. You can scan the source code of a project, calculate metric results and statistics, generate an interactive web app with graph structures (e.g. a dependency graph or a filesystem graph) and export the results in some file formats. Emerge currently has parsing support for the following languages: C, C++, Groovy, Java, JavaScript, TypeScript, Kotlin, ObjC, Ruby, Swift, Python, Go. The structure, coloring and clustering is calculated and based on the idea of combining a force-directed graph simulation and Louvain modularity. emerge is mainly written in Python 3 and is tested on macOS, linux and modern web browsers (i.e. latest Safari, Chrome, Firefox, Edge).
Goals of this project
emerge (/ɪˈməːdʒ/)
- to appear by coming out of something or out from behind something
- to become known, especially as a result of examining something or asking questions about it
The main goal of this project is to create a free/ open source tool, that can easily be used by anyone with interest in software development, architecture, metrics and visualization to gather more insights about those topics. It should facilitate/ support getting a better understanding of a given software project by using an exploratory approach.
The following features are currently supported by emerge
- File scan support for the following languages:
C,C++,Groovy,Java,JavaScript,TypeScript,Kotlin,ObjC,Ruby,Swift,Python - Basic entity scan/extraction (e.g. classes) for the following languages:
Groovy,Java,Kotlin,Swift - Implementation of the following software metrics: SLOC, Whitespace Complexity (impl. by A. Tornhill), Number of Methods, Fan-In/Fan-Out, Modularity (Louvain)
- Experimental implementation of additional
git-basedmetrics (SLOC, Whitespace Complexity, Change Coupling) - Infer meaning by feature/semantic keyword extraction based on term frequency-inverse document frequency
- Logging support with configurable log levels
- Configuration support based on YAML syntax to configure multiple/specific analyses
- Create a language/project configuration directly from an included configuration template
- Export of scan results/ metrics/ statistics for the following formats/ outputs
- File scan
- Dependency graph
- Entity scan
- Dependency graph
- Inheritance graph
- Complete graph (composition of dependency and inheritance graph)
- Includes the extraction of
SwiftUIandComposabledeclarative UI entities
- A Filesystem graph that shows the project filesystem hierarchy as a graph
- GraphML
- JavaScript format suited for a D3 force graph simulation
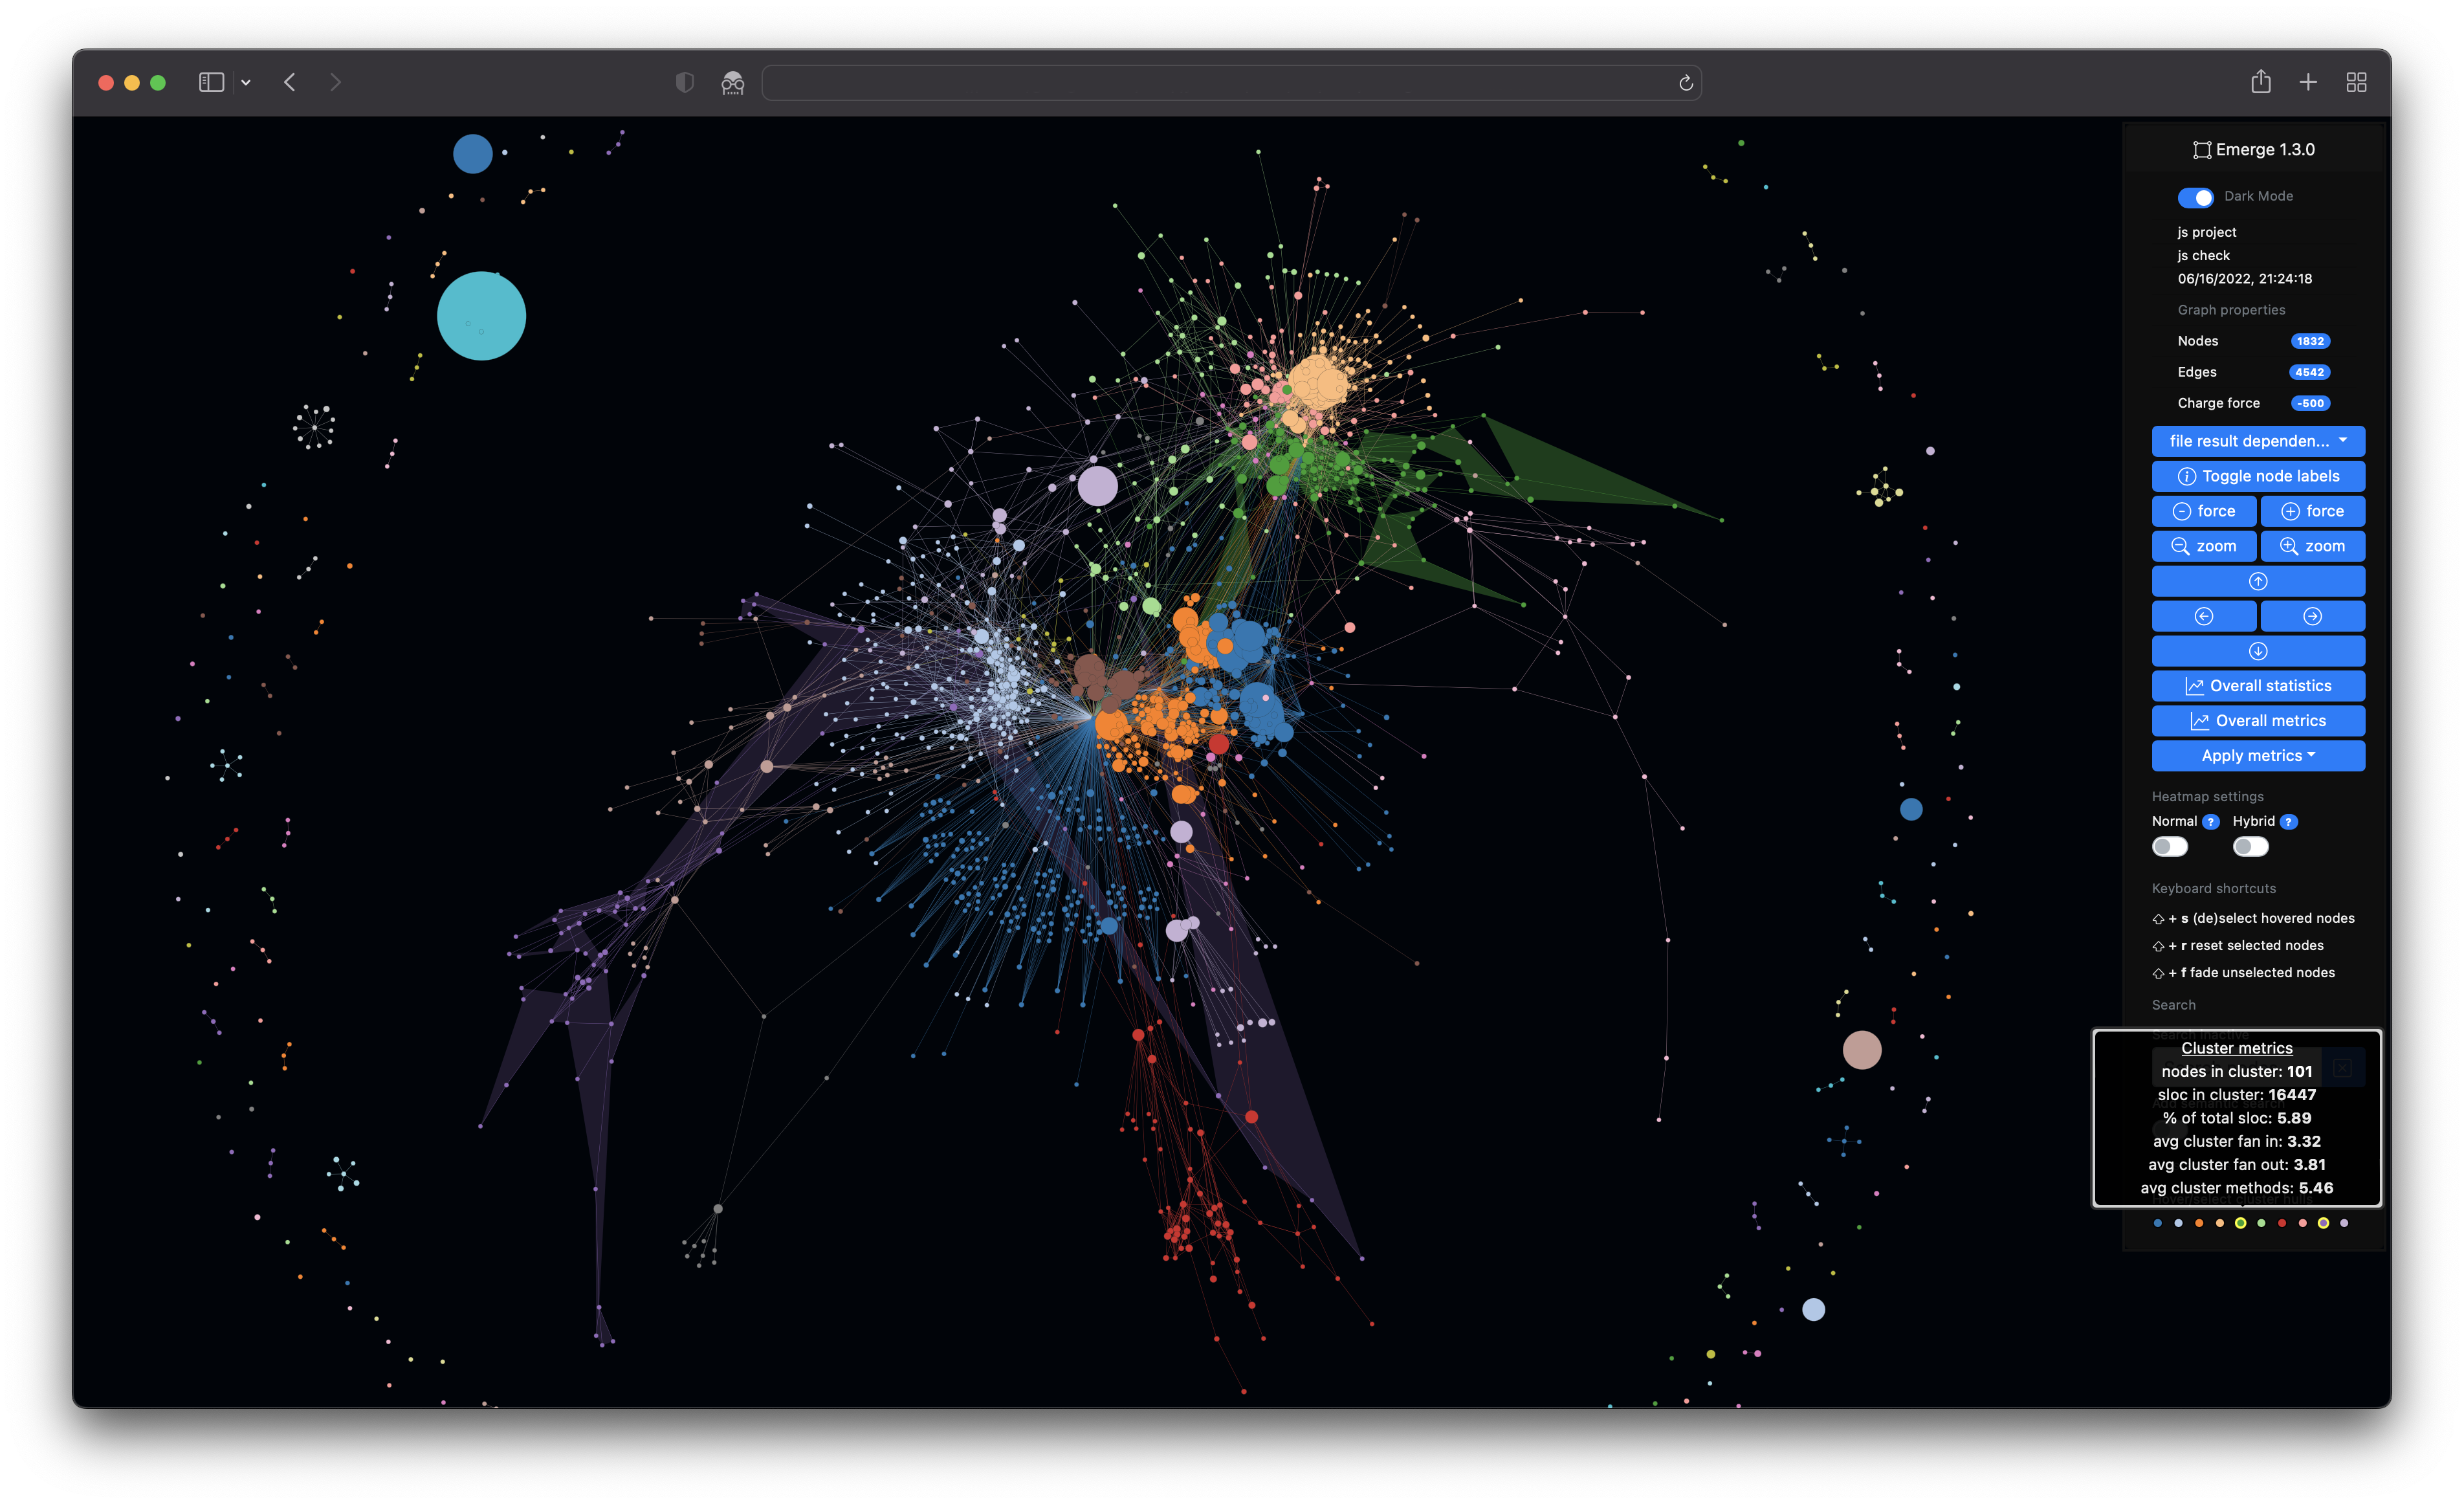
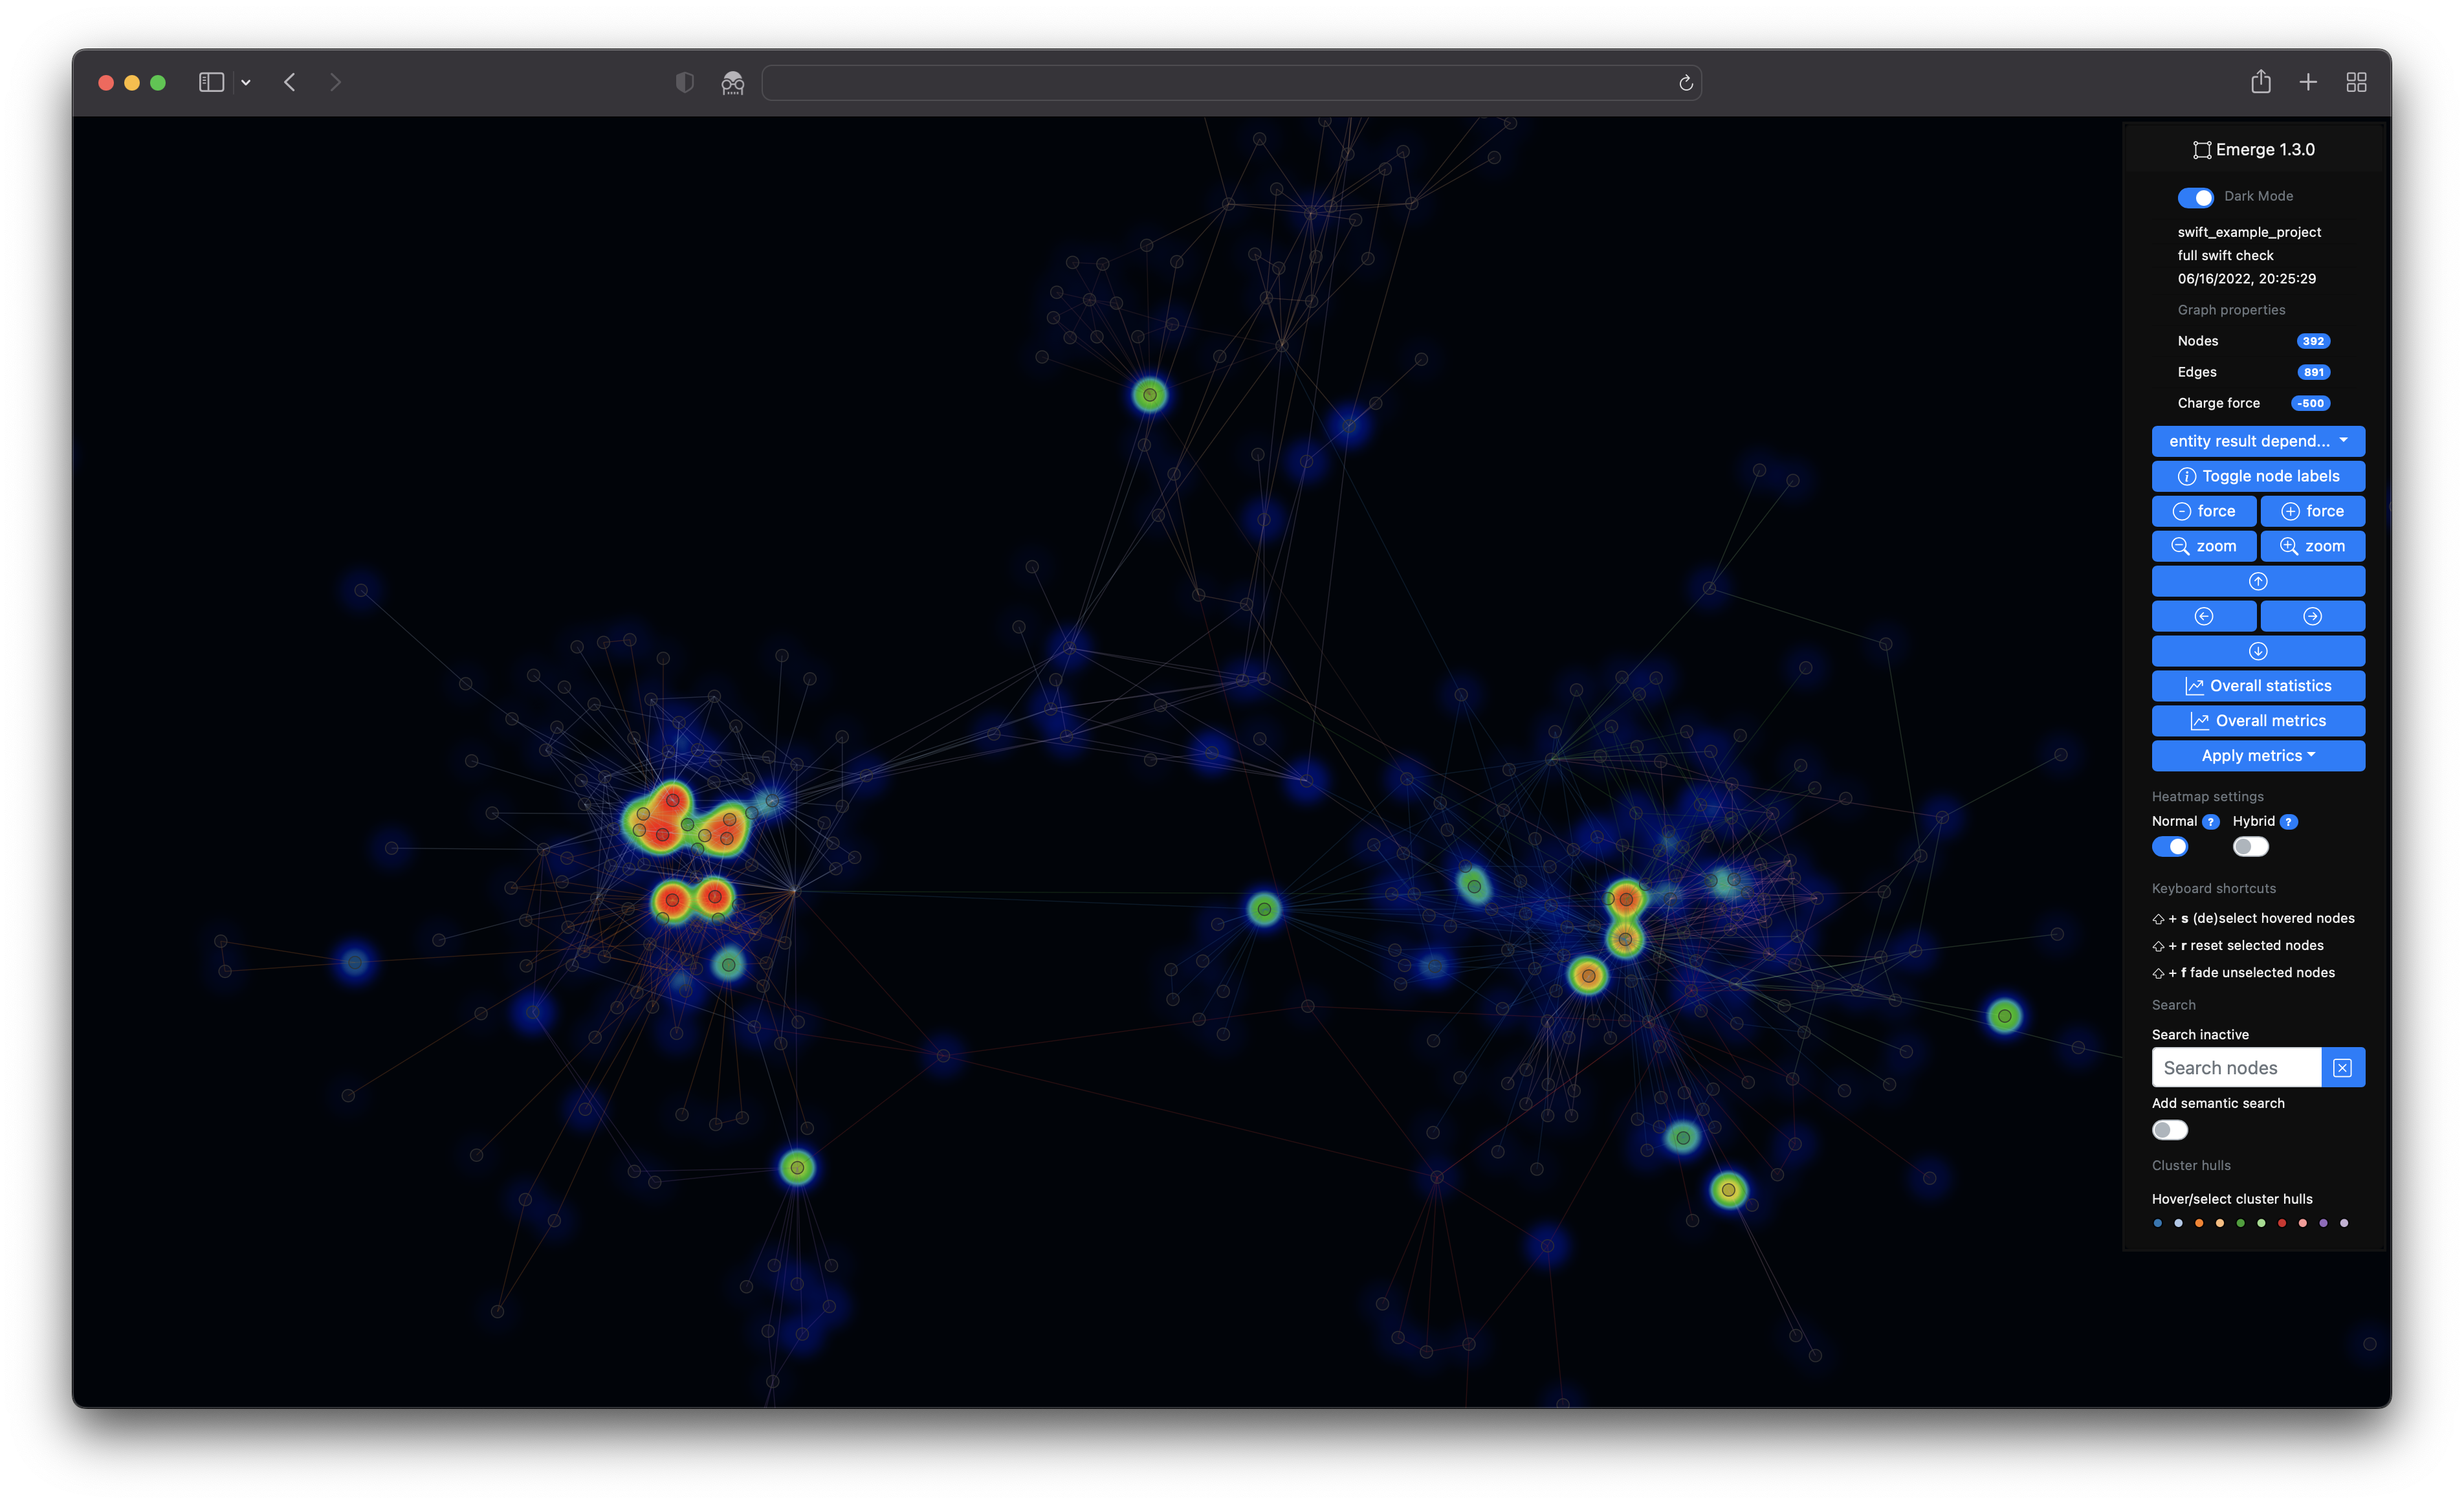
- Interactive HTML/ web application for interactive, exploratory analysis and data visualization of your project based on graph structures
- HTML app is based on Bootstrap
- Force-directed graph simulation by D3
- The node colors are based on Louvain modularity with a bit of post-processing to make the graph coloring more deterministic and stable
- Fast full-screen UI rendering on HTML canvas
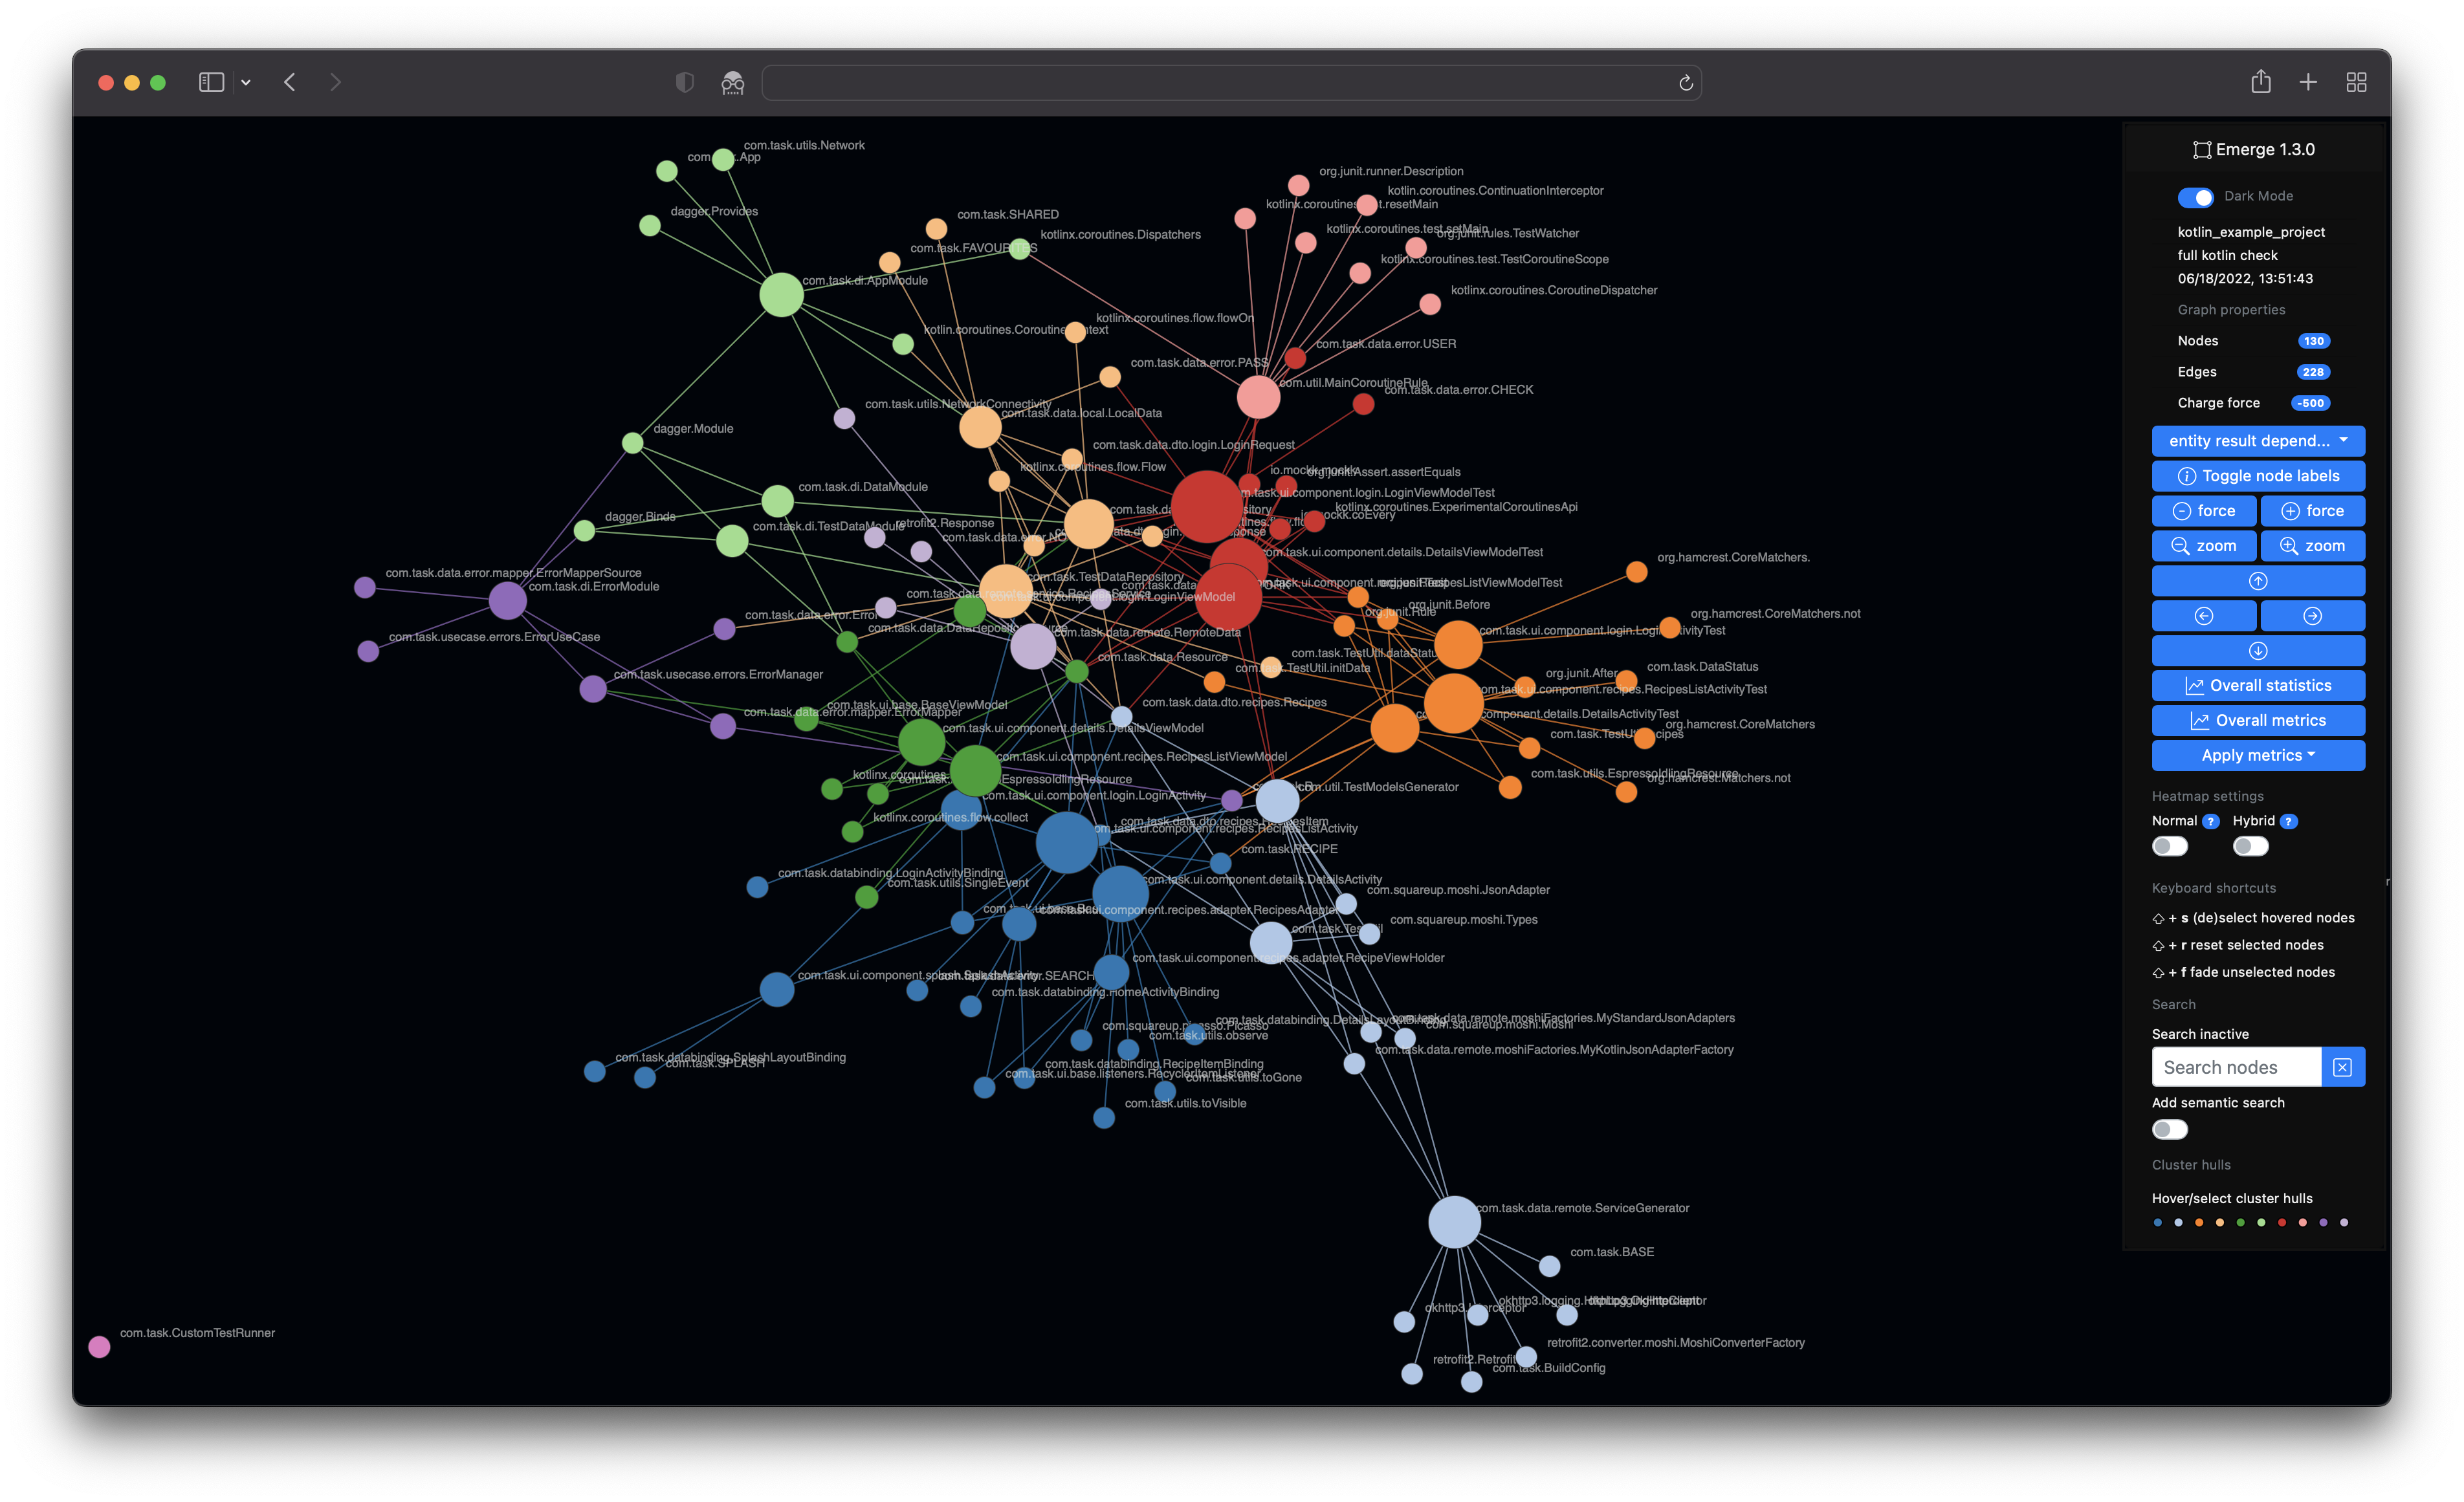
- Visualization of files, entities and given metrics
- Dark mode support
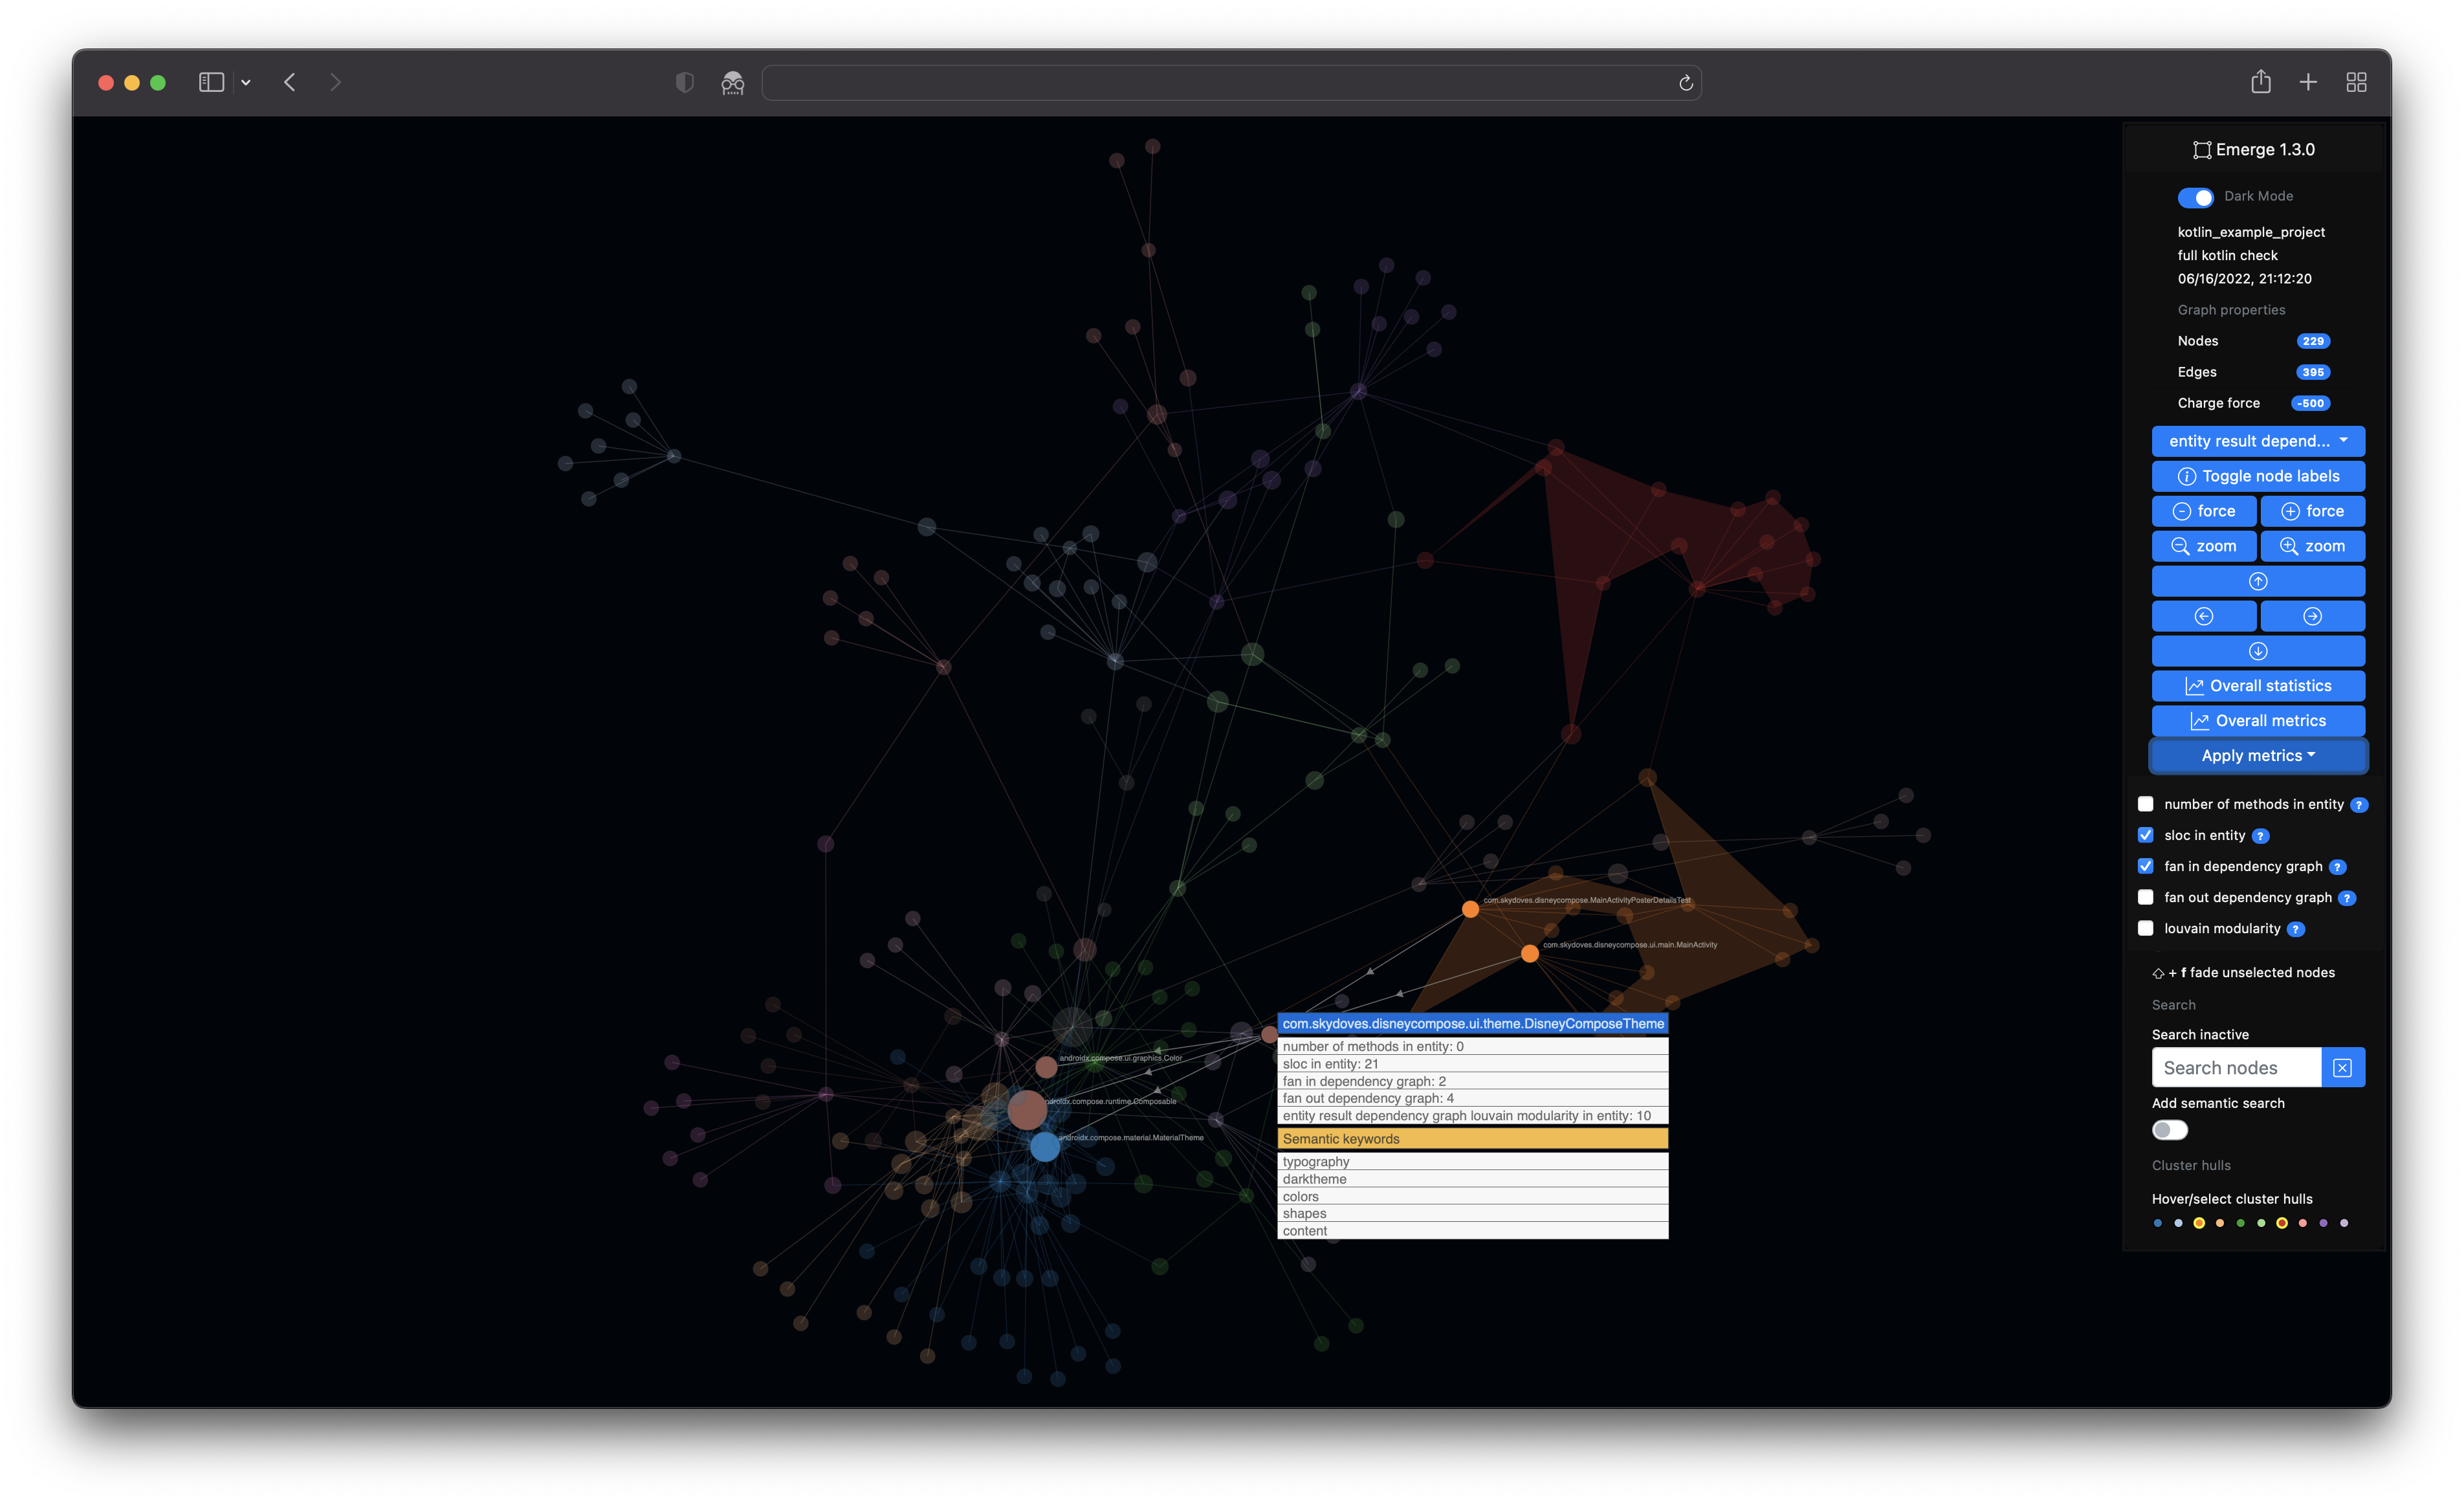
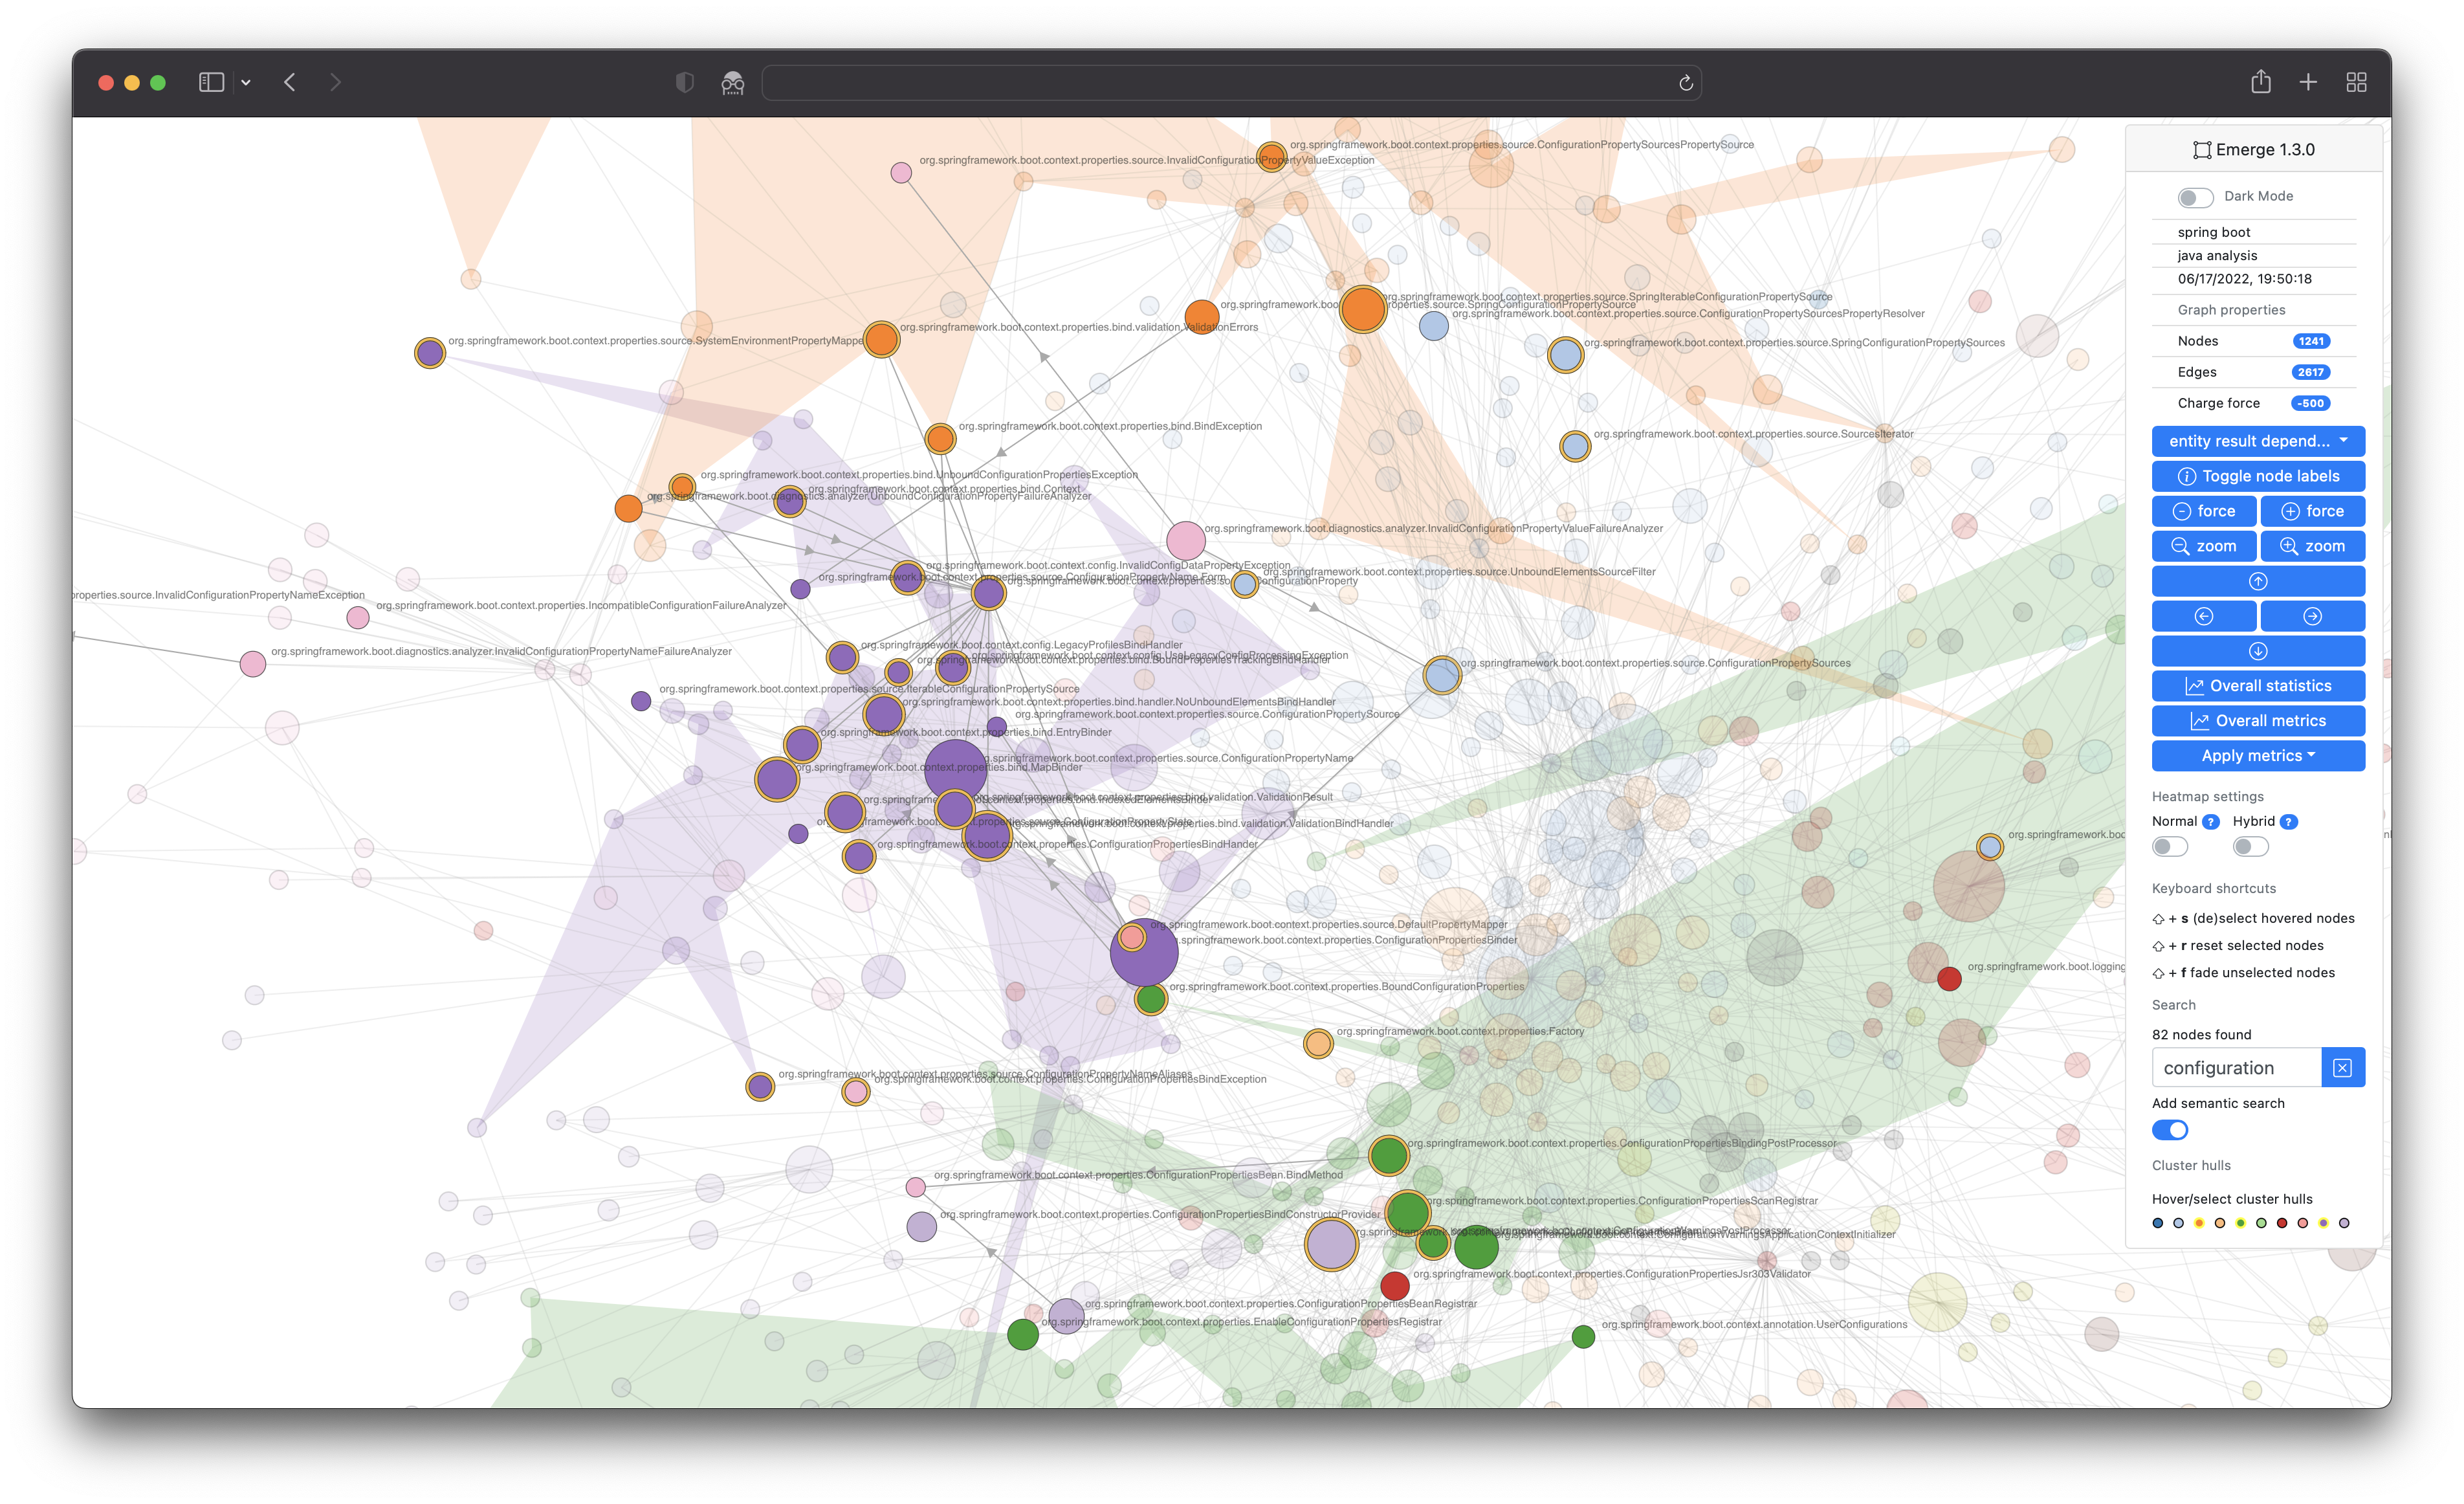
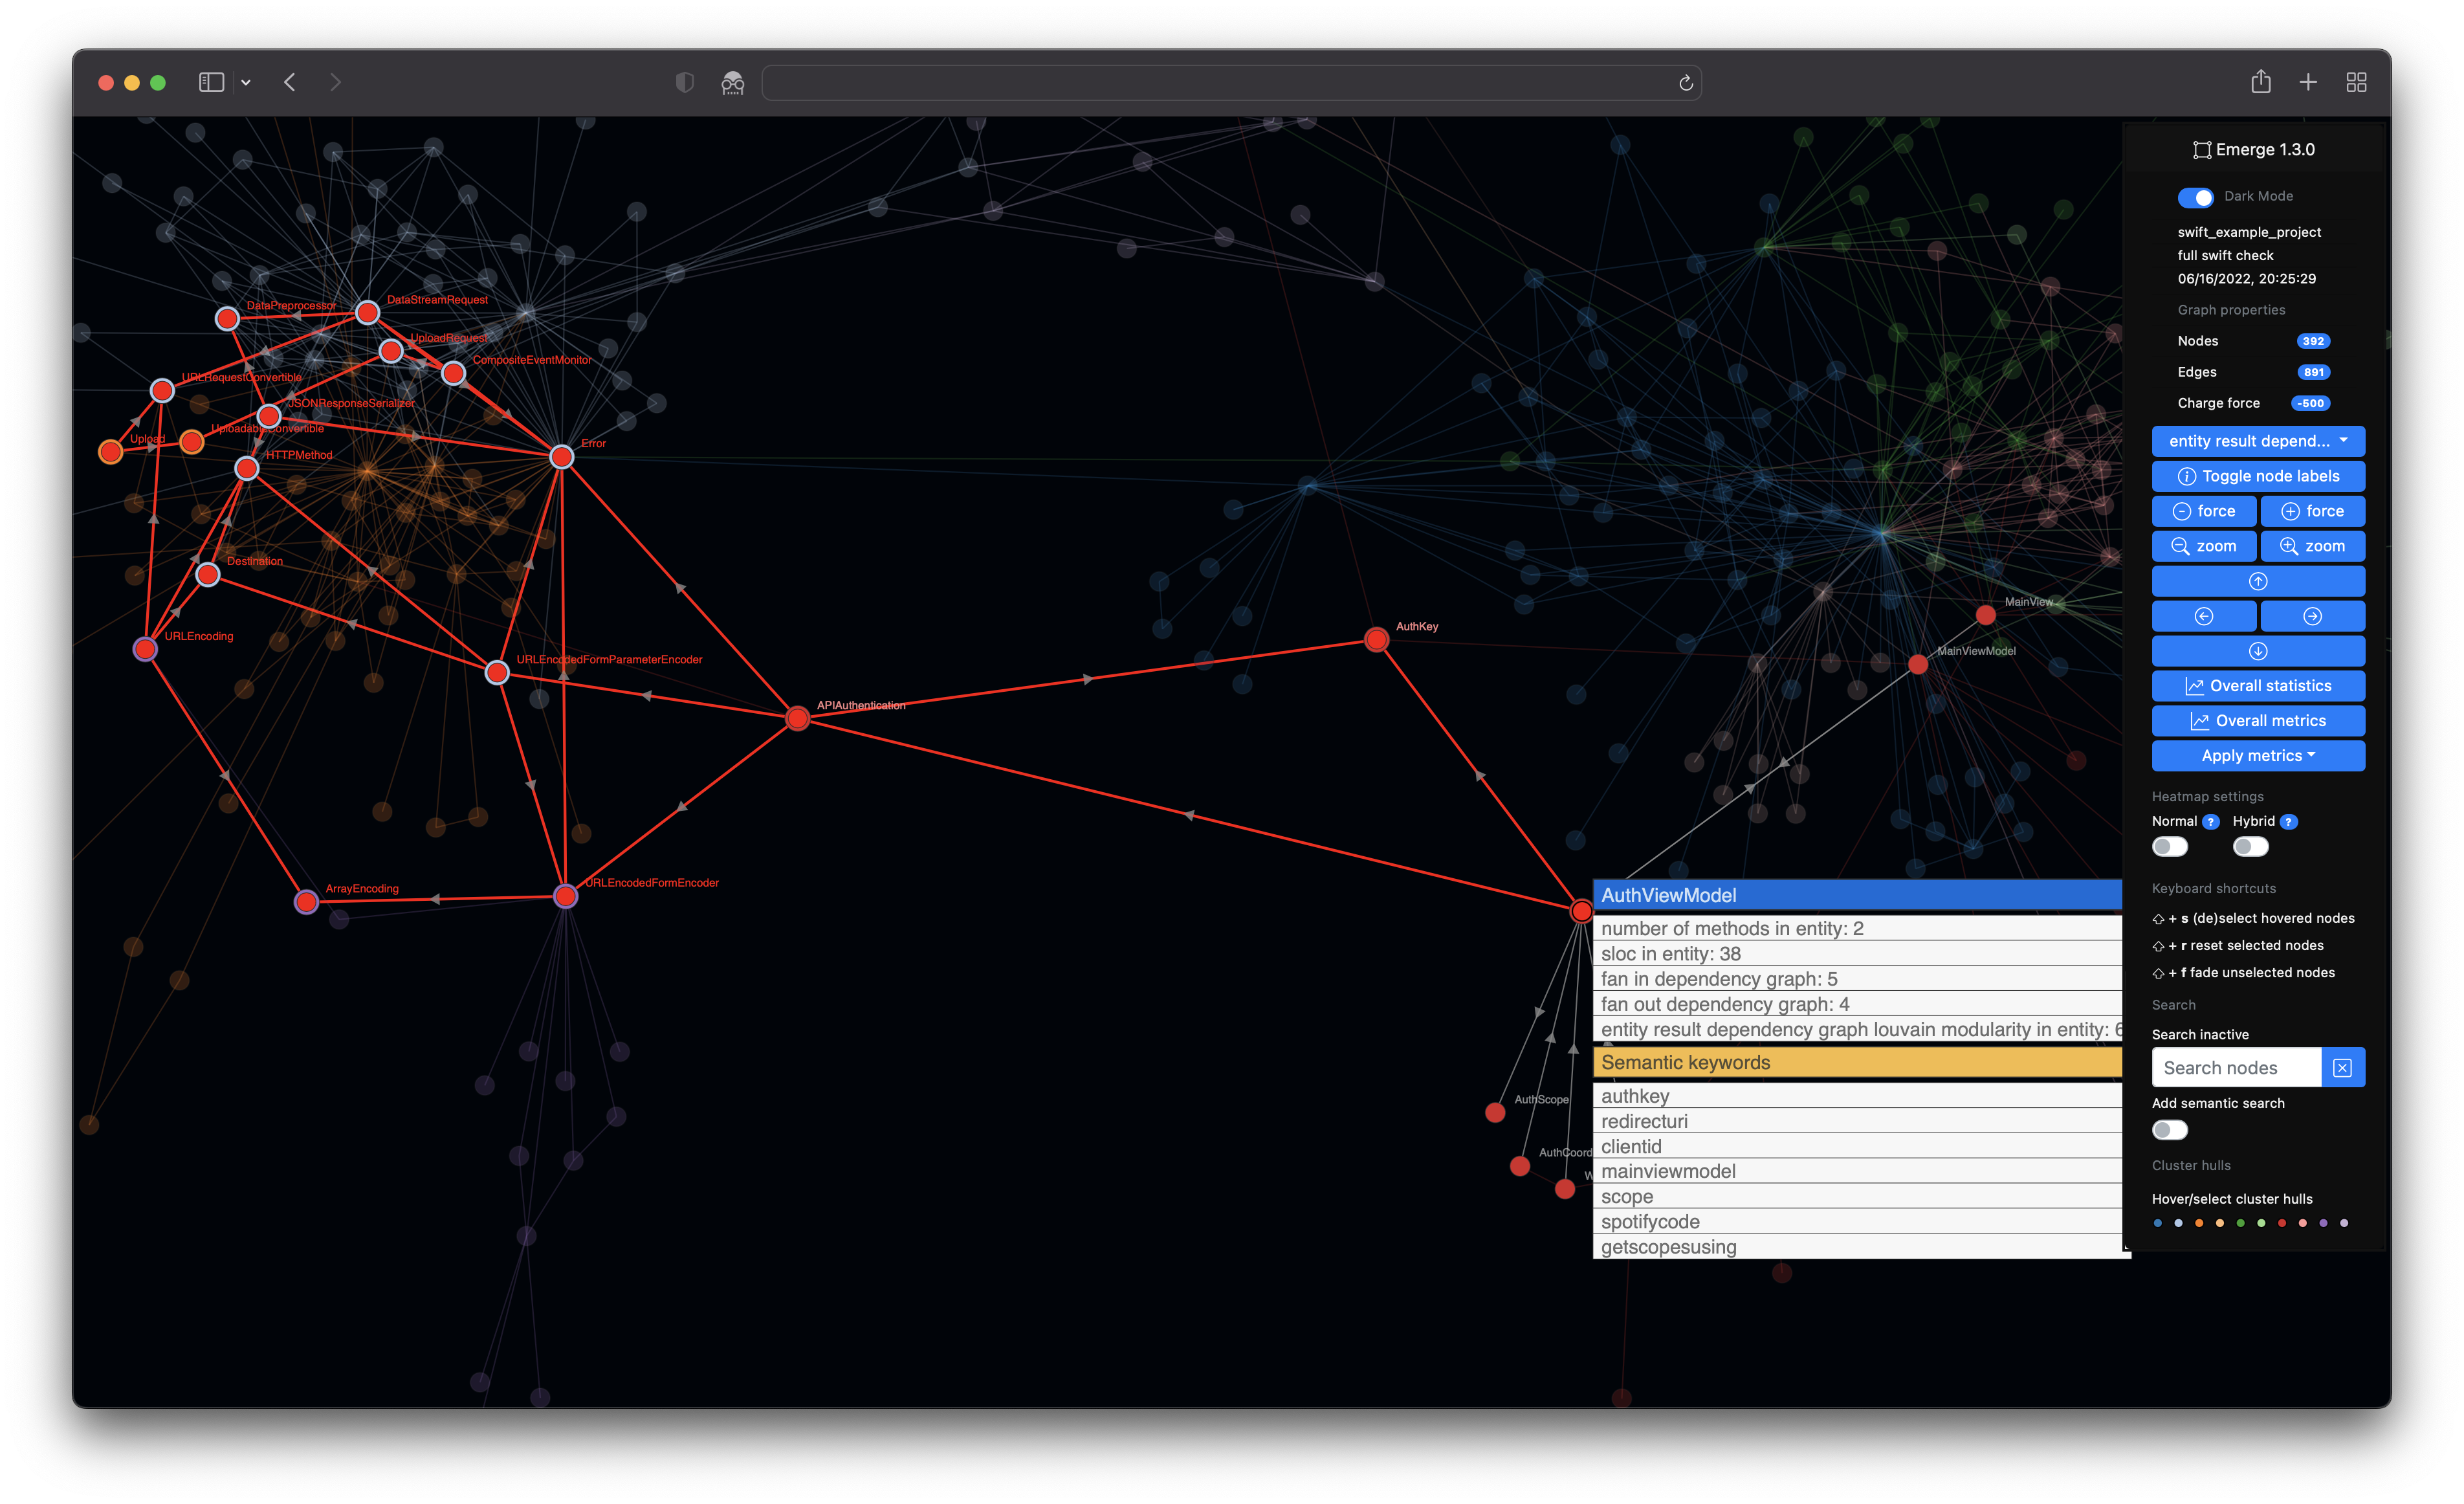
- Visual live search (OR'ed with multiple search terms) of entities
- The option to include a semantic search based on term frequency-inverse document frequency
- The option to include git-based metainformation e.g. contributor names
- Selection and highlighting of individual nodes
- Concave hull visualization of single clusters
- Heatmap visualization support of potentially harmful nodes based on a SLOC/Fan-Out score
- [Heatmap] visualization of of
git-basedmetrics e.g. code churn - Display of cluster metrics to facilitate comparability
- Interactivity given by translation, zooming, dragging and hovering over nodes
- Tabular console output
- Tabular file output
- JSON file output
- File scan
How to use emerge as Docker container
The easiest way to use emerge in a pre build Docker container. The only prerequisite is to have a Docker engine. For example the Docker Desktop.
Prepare your working folder like this
config.yml
📁export
📁source
- config.yml = configuration file
- export = folder for your export
- source = folder which contains your source code.
The command to run the analysis is than:
docker run --rm -v <YOUR_WORKING_FOLDER_PATH>:/tmp/emerge achtelik/emerge:2.0.0 /tmp/emerge/config.yml
The last parameter is the path to the config.yml inside the Docker container.
⚡You can ignore the Pyperclip error at the end of the run.
config.yml
If you use the suggestion from above, than pay attention that your analyses.source_directory and export.directory path have to start with /tmp/emerge. This is necessary because your analysis is running inside the Docker container.
For example:
---
project_name: java_project_example
loglevel: info
analyses:
- analysis_name: full java check
  source_directory: /tmp/emerge/source
  .
  .
  .
  export:
  - directory: /tmp/emerge/export
  .
  .
  .
💡The Docker container itself is path independent. Feel free to use your own volume mount and project config paths.
How to install and use emerge as a user
Basically there are two ways to install emerge. If you're familiar with pip (a virtual environment by using pyenv, virtualenv and virtualenvwrapper is recommended, but not needed) you can simply install the latest version of emerge with the following few steps.
0️⃣ ~ (Optional) Setup a virtual environment with pyenv
The recommended way would be to use a virtual env, you can do this by using the following example:
pyenv install 3.10.0
pyenv virtualenv 3.10.0 venv-3.10.0
pyenv activate venv-3.10.0
1️⃣ ~ Install emerge with pip
You can simply install emerge by using pip.
1️⃣.1️⃣ ~ (ubuntu) install prerequisites
On Ubuntu 20.04+ pleaase make sure that the packages graphviz and graphviz-dev are installed, i.e.
apt-get install graphviz graphviz-dev
1️⃣.2️⃣ ~ Install with pip
Either install as new package with:
pip install emerge-viz
or if it's already installed, just update with:
pip install -U emerge-viz
and then simply execute it like this:
(emerge) user@host ~ % emerge
usage: emerge [-h] [-c YAMLCONFIG] [-v] [-d] [-e] [-a LANGUAGE]

🔎 Welcome to emerge x.y.z (yyyy-mm-dd hh:mm:ss)

options:
  -h, --help            show this help message and exit
  -c YAMLCONFIG, --config YAMLCONFIG
                        set yaml config file
  -v, --verbose         set logging level to INFO
  -d, --debug           set logging level to DEBUG
  -e, --error           set logging level to ERROR
  -a LANGUAGE, --add-config LANGUAGE
                        add a new config from a template, where LANGUAGE is one of [JAVA, SWIFT, C, CPP, GROOVY, JAVASCRIPT,
                        TYPESCRIPT, KOTLIN, OBJC, RUBY, PY, GO]
2️⃣ ~ Create and adjust project configuration
You can create a simple project config adhoc from the command line and then simply adjust the necessary source/export paths
(emerge) user@host tmp % pwd
/Users/user1/tmp
(emerge) user@host tmp % emerge -a java
✅ created config file from template: /Users/user1/tmp/java-template.yaml
and then simply adjust the necessary paths (analyses/source_directory and export/directory):
(emerge) user@host tmp % cat java-template.yaml
---
project_name: java_project_example
loglevel: info
analyses:
- analysis_name: full java check
  source_directory: /Users/user1/emerge/project/source
  only_permit_languages:
  - java
  only_permit_file_extensions:
  - .java
  file_scan:
  - number_of_methods
  - source_lines_of_code
  - dependency_graph
  - fan_in_out
  - louvain_modularity
  - tfidf
  entity_scan:
  - dependency_graph
  - source_lines_of_code
  - number_of_methods
  - fan_in_out
  - louvain_modularity
  - tfidf
  export:
  - directory: /Users/user1/emerge/project/export
  - graphml
  - json
  - tabular_file
  - tabular_console_overall
  - d3
(emerge) user@host tmp %
`
