Xcprofiler
:chart_with_upwards_trend: CLI to profile compilation time of Swift project
Install / Use
/learn @giginet/XcprofilerREADME
xcprofiler

![]()
![]()

![]()
Command line utility to profile compilation time of Swift project.
This tool is developed in working time for Cookpad.
Installation
gem install xcprofiler
xcprofiler is tested on latest Ruby 2.3/2.4.
Usage
-
Add
-Xfrontend -debug-time-function-bodiesbuild flags inBuild Settings->Other Swift Flagssection of your Xcode project.
-
Build your project
-
Execute
xcprofiler
$ xcprofiler [PRODUCT_NAME or ACTIVITY_LOG_PATH] [options]
xcprofiler searches the latest build log on your DerivedData directory.
You can also specify the .xcactivitylog.
$ xcprofiler MyApp
$ xcprofiler ~/Library/Developer/Xcode/DerivedData/MyApp-xxxxxxxxxxx/Logs/Build/0761C73D-3B6C-449A-BE89-6D11DAB748FE.xcactivitylog
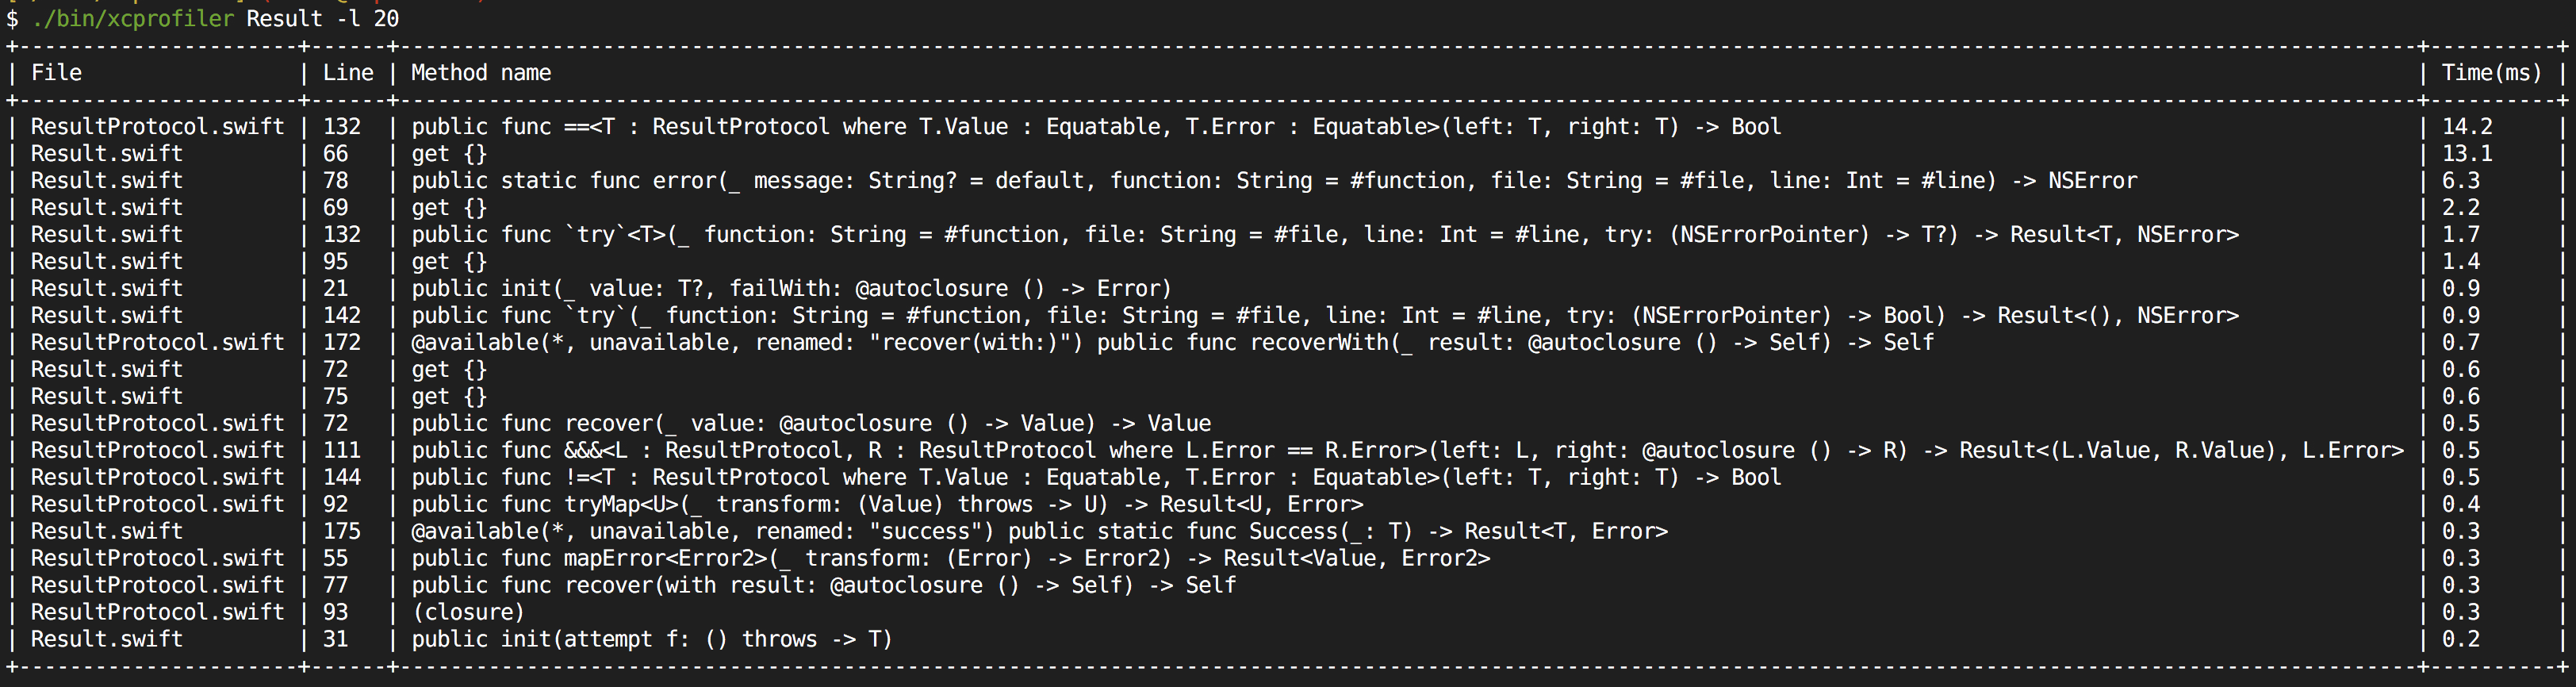
Sample output is here
+----------------------+------+---------------------------------------------------------------------------------------------------------------------------------------------------------------+----------+
| File                 | Line | Method name                                                                                                                                                   | Time(ms) |
+----------------------+------+---------------------------------------------------------------------------------------------------------------------------------------------------------------+----------+
| ResultProtocol.swift | 132  | public func ==<T : ResultProtocol where T.Value : Equatable, T.Error : Equatable>(left: T, right: T) -> Bool                                                  | 14.2     |
| Result.swift         | 66   | get {}                                                                                                                                                        | 13.1     |
| Result.swift         | 78   | public static func error(_ message: String? = default, function: String = #function, file: String = #file, line: Int = #line) -> NSError                      | 6.3      |
| Result.swift         | 69   | get {}                                                                                                                                                        | 2.2      |
| Result.swift         | 132  | public func `try`<T>(_ function: String = #function, file: String = #file, line: Int = #line, try: (NSErrorPointer) -> T?) -> Result<T, NSError>              | 1.7      |
| Result.swift         | 95   | get {}                                                                                                                                                        | 1.4      |
| Result.swift         | 21   | public init(_ value: T?, failWith: @autoclosure () -> Error)                                                                                                  | 0.9      |
| Result.swift         | 142  | public func `try`(_ function: String = #function, file: String = #file, line: Int = #line, try: (NSErrorPointer) -> Bool) -> Result<(), NSError>              | 0.9      |
| ResultProtocol.swift | 172  | @available(*, unavailable, renamed: "recover(with:)") public func recoverWith(_ result: @autoclosure () -> Self) -> Self                                      | 0.7      |
| Result.swift         | 72   | get {}                                                                                                                                                        | 0.6      |
| Result.swift         | 75   | get {}                                                                                                                                                        | 0.6      |
| ResultProtocol.swift | 72   | public func recover(_ value: @autoclosure () -> Value) -> Value                                                                                               | 0.5      |
| ResultProtocol.swift | 111  | public func &&&<L : ResultProtocol, R : ResultProtocol where L.Error == R.Error>(left: L, right: @autoclosure () -> R) -> Result<(L.Value, R.Value), L.Error> | 0.5      |
| ResultProtocol.swift | 144  | public func !=<T : ResultProtocol where T.Value : Equatable, T.Error : Equatable>(left: T, right: T) -> Bool                                                  | 0.5      |
| ResultProtocol.swift | 92   | public func tryMap<U>(_ transform: (Value) throws -> U) -> Result<U, Error>                                                                                   | 0.4      |
| Result.swift         | 175  | @available(*, unavailable, renamed: "success") public static func Success(_: T) -> Result<T, Error>                                                           | 0.3      |
| ResultProtocol.swift | 55   | public func mapError<Error2>(_ transform: (Error) -> Error2) -> Result<Value, Error2>                                                                         | 0.3      |
| ResultProtocol.swift | 77   | public func recover(with result: @autoclosure () -> Self) -> Self                                                                                             | 0.3      |
| ResultProtocol.swift | 93   | (closure)                                                                                                                                                     | 0.3      |
| Result.swift         | 31   | public init(attempt f: () throws -> T)                                                                                                                        | 0.2      |
+----------------------+------+---------------------------------------------------------------------------------------------------------------------------------------------------------------+----------+
Available Options
|option|shorthand|description| |------|---------|-----------| |--limit|-l|Limit for display| |--threshold||Threshold of time to display (ms)| |--show-invalids||Show invalid location results| |--order|-o|Sort order (default,time,file)| |--derived-data-path||Root path of DerivedData directory| |--truncate-at|-t|Truncate the method name with specified length| |--no-unique||Show the duplicated results|
Use custom reporters
You can use reporters to output tracking logs.
require 'xcprofiler'

profiler = Xcprofiler::Profiler.by_product_name('MyApp')
profiler.reporters = [
  Xcprofiler::StandardOutputReporter.new(limit: 20, order: :time),
  Xcprofiler::JSONReporter.new(output_path: 'result.json'),
  Xcprofiler::BlockReporter.new do |executions|
    do_something(executions)
  end,
]
profiler.report!
You can also implement your own reporters.
See implementation of built-in reporters for detail.
danger-xcprofiler
You can integrate xcprofiler to danger.
https://github.com/giginet/danger-xcprofiler
License
MIT License
Contributing
Bug reports and pull requests are welcome on GitHub at https://github.com/giginet/xcprofiler.
Related Skills
node-connect
351.4kDiagnose OpenClaw node connection and pairing failures for Android, iOS, and macOS companion apps
frontend-design
110.7kCreate distinctive, production-grade frontend interfaces with high design quality. Use this skill when the user asks to build web components, pages, or applications. Generates creative, polished code that avoids generic AI aesthetics.
openai-whisper-api
351.4kTranscribe audio via OpenAI Audio Transcriptions API (Whisper).
qqbot-media
351.4kQQBot 富媒体收发能力。使用 <qqmedia> 标签,系统根据文件扩展名自动识别类型(图片/语音/视频/文件)。
