Fanova
Functional ANOVA
Install / Use
/learn @frank-hutter/FanovaREADME
Fanova
Functional ANOVA: an implementation of the ICML 2014 paper "An Efficient Approach for Assessing Hyperparameter Importance" by Frank Hutter, Holger Hoos and Kevin Leyton-Brown.
Requirements
Fanova requires Java 7.
Installation
Manually
git clone https://github.com/automl/fanova.git
cd fanova/
python setup.py install
Example usage
To run the examples, just download the data and start the python console. We can then import Fanova and start it by typing
>>> from pyfanova.fanova import Fanova
>>> f = Fanova("example/online_lda")
This creates a new Fanova object and fits the Random Forest on the specified data set. (Note: if you use data generated by SMAC, replace the above path with the path to the state-run directory)
To compute now the marginal of the first parameter type:
>>> f.get_marginal(0)
5.44551614362
Fanova also allows to specify parameters by their names.
>>> f.get_marginal("Col0")
5.44551614362
Pairwise marginals of two parameters can be computed with the command
>>>  f.get_pairwise_marginal(0, 1)
0.9370525790628655
Again the same can been done by specifing names instead of indices
>>> f.get_pairwise_marginal("Col0","Col1")
0.9370525790628655
If we want to compute the mean and standard deviation of a parameter for a certain value, we can use
>>> f.get_marginal_for_value("Col0", 0.1)
(1956.6644432031385, 110.58740682895211)
To visualize the single and pairwise marginals, we have to create a visualizer object first
>>> from pyfanova.visualizer import Visualizer
>>> vis = Visualizer(f)
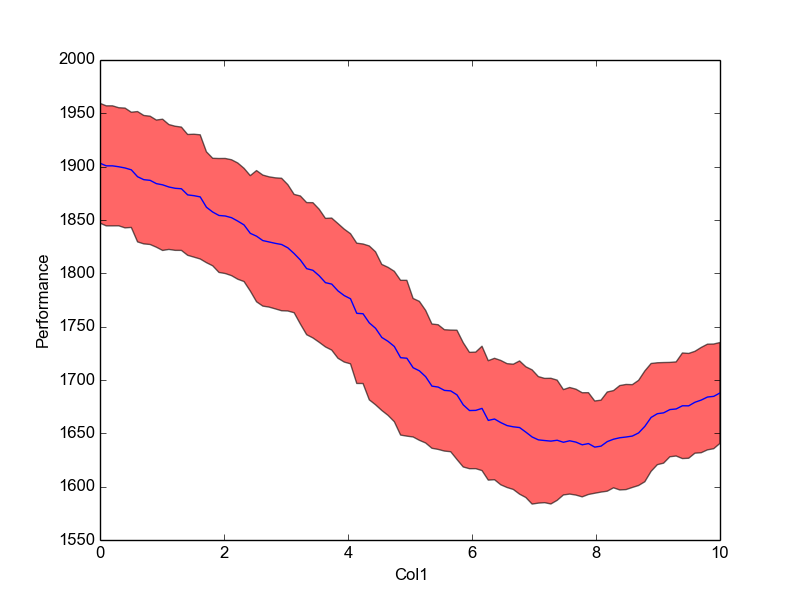
We can then plot single marginals by
>>> plot = vis.plot_marginal("Col1")
>>> plot.show()
what should look like this
The same can been done for pairwise marginals
>>> vis.plot_pairwise_marginal("Col0", "Col2")

At last, all plots can be created together and stored in a directory with
>>> vis.create_all_plots("./plots/")
If your data is stored in csv file, you can run Fanova with
>>> from pyfanova.fanova_from_csv import FanovaFromCSV
>>> f = FanovaFromCSV("/path_to_data/data.csv")
Please make sure, that your csv file has the form
| X0 | X1 | ... | Y | |:-------|:------:|:------:| ------:| | 0.1 | 0.2 | ... | 0.3 | | 0.3 | 0.4 | ... | 0.6 |
It is also possible to run Fanova on data colleted by HPOlib
>>> from pyfanova.fanova_from_hpolib import FanovaFromHPOLib
>>> f = FanovaFromHPOLib("params.pcs",["data.pkl"])
Related Skills
node-connect
353.3kDiagnose OpenClaw node connection and pairing failures for Android, iOS, and macOS companion apps
frontend-design
111.7kCreate distinctive, production-grade frontend interfaces with high design quality. Use this skill when the user asks to build web components, pages, or applications. Generates creative, polished code that avoids generic AI aesthetics.
openai-whisper-api
353.3kTranscribe audio via OpenAI Audio Transcriptions API (Whisper).
qqbot-media
353.3kQQBot 富媒体收发能力。使用 <qqmedia> 标签,系统根据文件扩展名自动识别类型(图片/语音/视频/文件)。
