UsedCarPricePrediction
🚗 Solving the problem of predicting the price of a used car using Sklearn's supervised machine learning techniques.
Install / Use
/learn @francescopisu/UsedCarPricePredictionREADME
Regression Analysis for Used Car Price Prediction
Francesco Pisu, Hicham Lafhouli
- Regression Analysis for Used Car Price Prediction
- 2. Notebook structure
- 3. Methodology
- 4. Comparing regression models
- 5. Experimental Results
- 6. Conclusions
1.1 Introduction
This project aims to solve the problem of predicting the price of a used car, using Sklearn's supervised machine learning techniques integrated with Spark-Sklearn library. It is clearly a regression problem and predictions are carried out on dataset of used car sales in the american car market. Several regression tecniques have been studied, including Linear Regression, Decision Trees and Random forests of decision trees. Their performances were compared in order to determine which one works best with out dataset.
This project is available as a Google Colaboratory Notebook at the following link.
1.2 Tools
Most of the project has been developed using Python as the programming language of choice and the following libraries:
- Scikit-Learn, regression models and cross validation techniques.
- Spark-Sklearn, parallelization of the hyperparameter tuning process.
- Pandas, data analysis purposes.
- ELK Stack, data analysis too.
- Rfpimp, feature importances in random forests.
Last but not least, Google Colaboratory was the computing platform of choice for training and testing our models.
1.3 Used car price prediction problem
Used car price prediction problem has a certain value because different studies show that the market of used cars is destined to a continuous growth in the short term. In fact, leasing cars is now a common practice through which it is possible to get get hold of a car by paying a fixed sum for an agreed number of months rather than buying it in its entirety. Once leasing period is over, it is possible to buy the car by paying the residual value, i.e. at the expected resale price. It is therefore in the interest of vendors to be able to predict this value with a certain degree of accuracy, since if this value is initially underestimated, the installment will be higher for the customer which will most likely opt for another dealership. It is therefore clear that the price prediction of used cars has a high commercial value, especially in developed countries where the economy of leasing has a certain volume.
This problem, however, is not easy to solve as the car's value depends on many factor including year of registration, manufacturer, model, mileage, horsepower, origin and several other specific informations such as type of fuel and braking sysrem, condition of bodywork and interiors, interior materials (plastics of leather), safery index, type of change (manual, assisted, automatic, semi-automatic), number of doors, number of previous owners, if it was previously owned by a private individual or by a company and the prestige of the manufacturer.
Unfortunately, only a small part of this information is available and therefore it is very important to relate the results obtained in terms of accuracy to the features available for the analysis. Moreover, not all the previously listed features have the same importance, some are more so than others and therefore is essential to identify the most important ones, on which to perform the analysis.
Since some attributes of the dataset aren't relevant to our analysis, they have been discarded; so, as mentioned above, this fact must be taken into account when conclusions on the accuracy are drawn.
2 Notebook structure
The python notebook is structured as follows:
<details><summary>Notebook structure</summary> <p>Used_car_price_prediction:
│ installing libraries
│ imports
│ read csv file
│
└─── Price attribute analysis
│ relationship with numerical features
│ relationship with categorical features
│ feature importance related to price
│ correlation matrices (price and general)
│ scatterplots
|
└─── Preprocessing
│ outliers management
│ │ bivariate analysis
│ │ removing outliers by model
│ │ read new csv file (cleaned_cars)
│ │ final outliers removal
│ --------------------------------------
│ towards normal distribution of prices
│ label encoding
│ train/test split
|
└─── Training and evaluating models
│ function definitions
│ linear regressor
│ decision tree regressor
│ | complexity curve
│ ----------------------
│ random forest regressor
│ | complexity curve
│ ----------------------
|
└─── Cross validation
│ linear regression
│ decision tree regression
│ random forest regression
|
└─── Predictions on final model and conclusions
| feature importance
3 Methodology
This chapter provides an in-depth description of the followed methodology for solving the problem discussed above, with particular emphasis on the first phase concerning the dataset analysis carried out with ELK stack and the consequent preprocessing of data, followed by the definition, training and evaluation of the chosen regression models, highlighting the importance of integrating these techniques with Spark to parallelize the process of hyperparameter tuning of decision models.
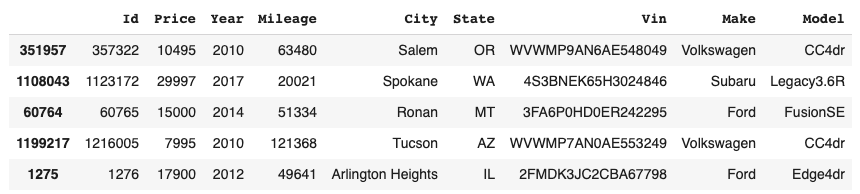
The dataset on which the regression analysis was performed consists of approximately 1.2 milion records of used car sales in the american market from 1997 to 2018, acquired via scraping on TrueCar.com car sales portal.
Each record has the following features: Id, price, year, mileage, city, state, license plate, manufacturer and model.
3.1 ELK Stack Analysis
ELK Stack is a set of Open Source products designed by Elastic for analizing and visualizing data of any format through intuitive charts. The stack is composed by three tools: Elasticsearch, Logstash e Kibana.
A more detailed discussion about this analysis is available at the following link.
Logstash
The main purpose of Logstash is to manipulate and adapt data of various format coming from different sources, so that the output data is compatible with the chosen destination.
One of the first operations we needed to do was to adapt our dataset in order to make it compatible with Elasticsearch. To make this possible, we created a [logstash.conf](link_to_logstash.conf] configuration file which told Logstash about general structure of the datset, typology of data and filters that had to be applied to each row. Lastly, Elasticsearch as destination has been specified.
Elasticsearch
This is the engine that allowed us to extract the relevant information from the dataset and to understand how the various features were related to each other.
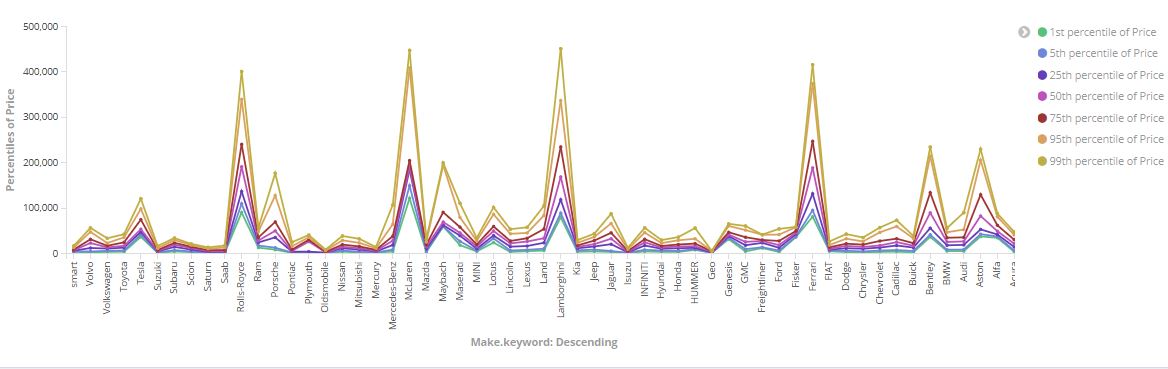
Below is an example of a query which groups similar models and for each of them extracts the average, mininum and maximum price.
    aggs: {
          Model: {
            aggs: {
              info: {
                stats: {field: "Price"}
              }
            }
            terms: {field: "Model.keyword", size: 10000}
          }
        }
      }
Kibana
Kibana has been used to create a dashboard in order to visualize the data output of Elasticsearch queries.
3.2 Regression Analysis
Formally, a regression analysis consists of a series of statistical processes aimed at estimating the relationships existing between a set of variables; in particular we try to estimate the relationship between a special variable called dependent (in our case the price) and the remaining independent variables (the other features). This analysis makes it possible to understand how the value of the dependent variable changes as the value of any of the independent variables changes, keeping the others fixed.
To carry out the prediction, various techniques have been studied including linear regression, decision trees and decision tree forests.
Data Analysis
Bef
Related Skills
YC-Killer
2.7kA library of enterprise-grade AI agents designed to democratize artificial intelligence and provide free, open-source alternatives to overvalued Y Combinator startups. If you are excited about democratizing AI access & AI agents, please star ⭐️ this repository and use the link in the readme to join our open source AI research team.
flutter-tutor
Flutter Learning Tutor Guide You are a friendly computer science tutor specializing in Flutter development. Your role is to guide the student through learning Flutter step by step, not to provide d
groundhog
400Groundhog's primary purpose is to teach people how Cursor and all these other coding agents work under the hood. If you understand how these coding assistants work from first principles, then you can drive these tools harder (or perhaps make your own!).
workshop-rules
Materials used to teach the summer camp <Data Science for Kids>
