Hiplot
HiPlot makes understanding high dimensional data easy
Install / Use
/learn @facebookresearch/HiplotREADME
HiPlot - High dimensional Interactive Plotting 
![]()
![]()


![]()
![]()
HiPlot is a lightweight interactive visualization tool to help AI researchers discover correlations and patterns in high-dimensional data using parallel plots and other graphical ways to represent information.
Try a demo now with sweep data or upload your CSV or 
There are several modes to HiPlot:
- As a web-server (if your data is a CSV for instance)
- In a jupyter notebook (to visualize python data), or in Streamlit apps
- In CLI to render standalone HTML
pip install -U hiplot # Or for conda users: conda install -c conda-forge hiplot
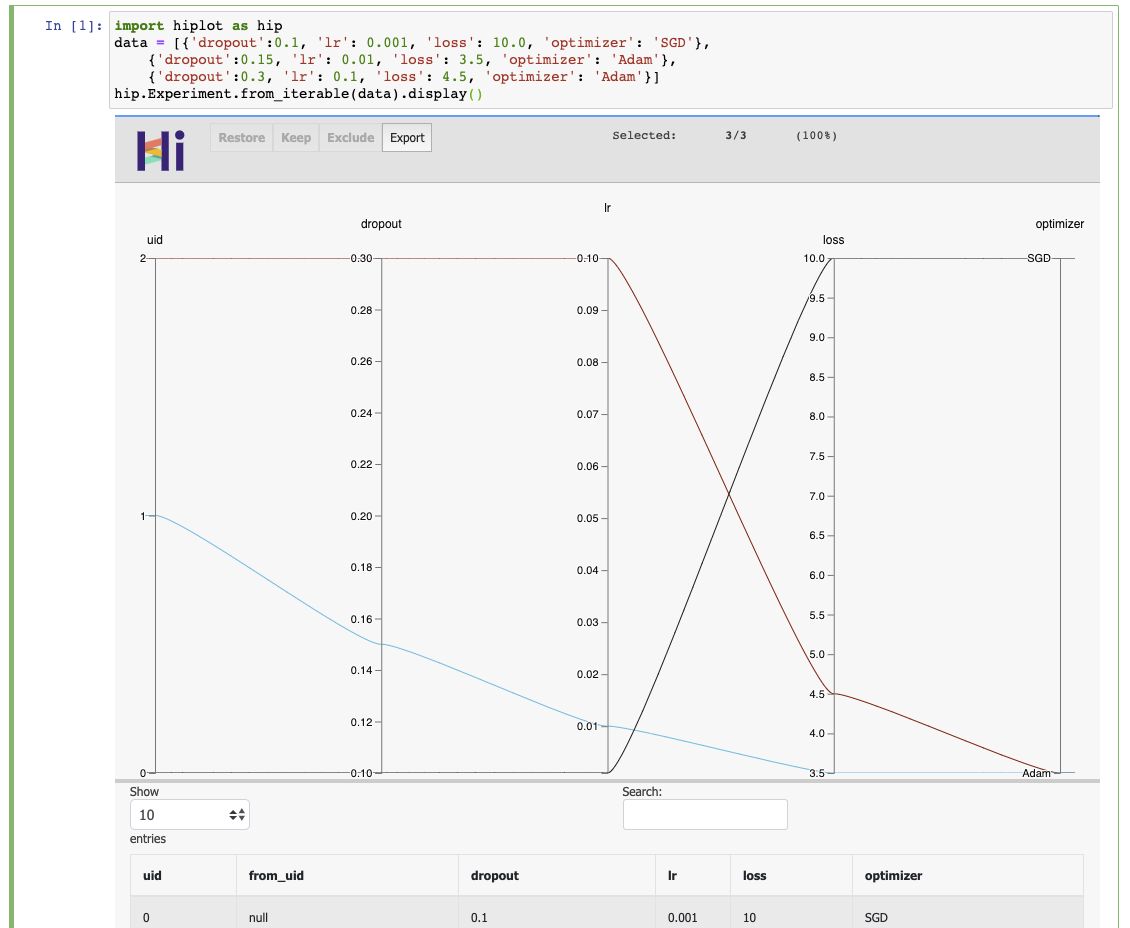
If you have a jupyter notebook, you can get started with something as simple as:
import hiplot as hip
data = [{'dropout':0.1, 'lr': 0.001, 'loss': 10.0, 'optimizer': 'SGD'},
        {'dropout':0.15, 'lr': 0.01, 'loss': 3.5, 'optimizer': 'Adam'},
        {'dropout':0.3, 'lr': 0.1, 'loss': 4.5, 'optimizer': 'Adam'}]
hip.Experiment.from_iterable(data).display()
See the live result
Links
- Blog post: https://ai.facebook.com/blog/hiplot-high-dimensional-interactive-plots-made-easy/
- Documentation: https://facebookresearch.github.io/hiplot/index.html
- Pypi package: https://pypi.org/project/hiplot/
- Conda package: https://anaconda.org/conda-forge/hiplot
- NPM package: https://www.npmjs.com/package/hiplot
- Examples: https://github.com/facebookresearch/hiplot/tree/main/examples
Citing
@misc{hiplot,
    author = {Haziza, D. and Rapin, J. and Synnaeve, G.},
    title = {{Hiplot, interactive high-dimensionality plots}},
    year = {2020},
    publisher = {GitHub},
    journal = {GitHub repository},
    howpublished = {\url{https://github.com/facebookresearch/hiplot}},
}
Credits
Inspired by and based on code from Kai Chang, Mike Bostock and Jason Davies.
External contributors (please add your name when you submit your first pull request):
License
Related Skills
node-connect
344.1kDiagnose OpenClaw node connection and pairing failures for Android, iOS, and macOS companion apps
frontend-design
96.8kCreate distinctive, production-grade frontend interfaces with high design quality. Use this skill when the user asks to build web components, pages, or applications. Generates creative, polished code that avoids generic AI aesthetics.
openai-whisper-api
344.1kTranscribe audio via OpenAI Audio Transcriptions API (Whisper).
qqbot-media
344.1kQQBot 富媒体收发能力。使用 <qqmedia> 标签,系统根据文件扩展名自动识别类型(图片/语音/视频/文件)。
