DunedinPACNI
Code to estimate DunedinPACNI scores from FreeSurfer parcellations of brain MRI data.
Install / Use
/learn @etw11/DunedinPACNIREADME
DunedinPACNI
DunedinPACNI is novel brain-based aging biomarker of the pace of biological aging. DunedinPACNI scores represent the speed of aging, with higher scores indicating faster aging and lower scores indicating slower aging.
Background
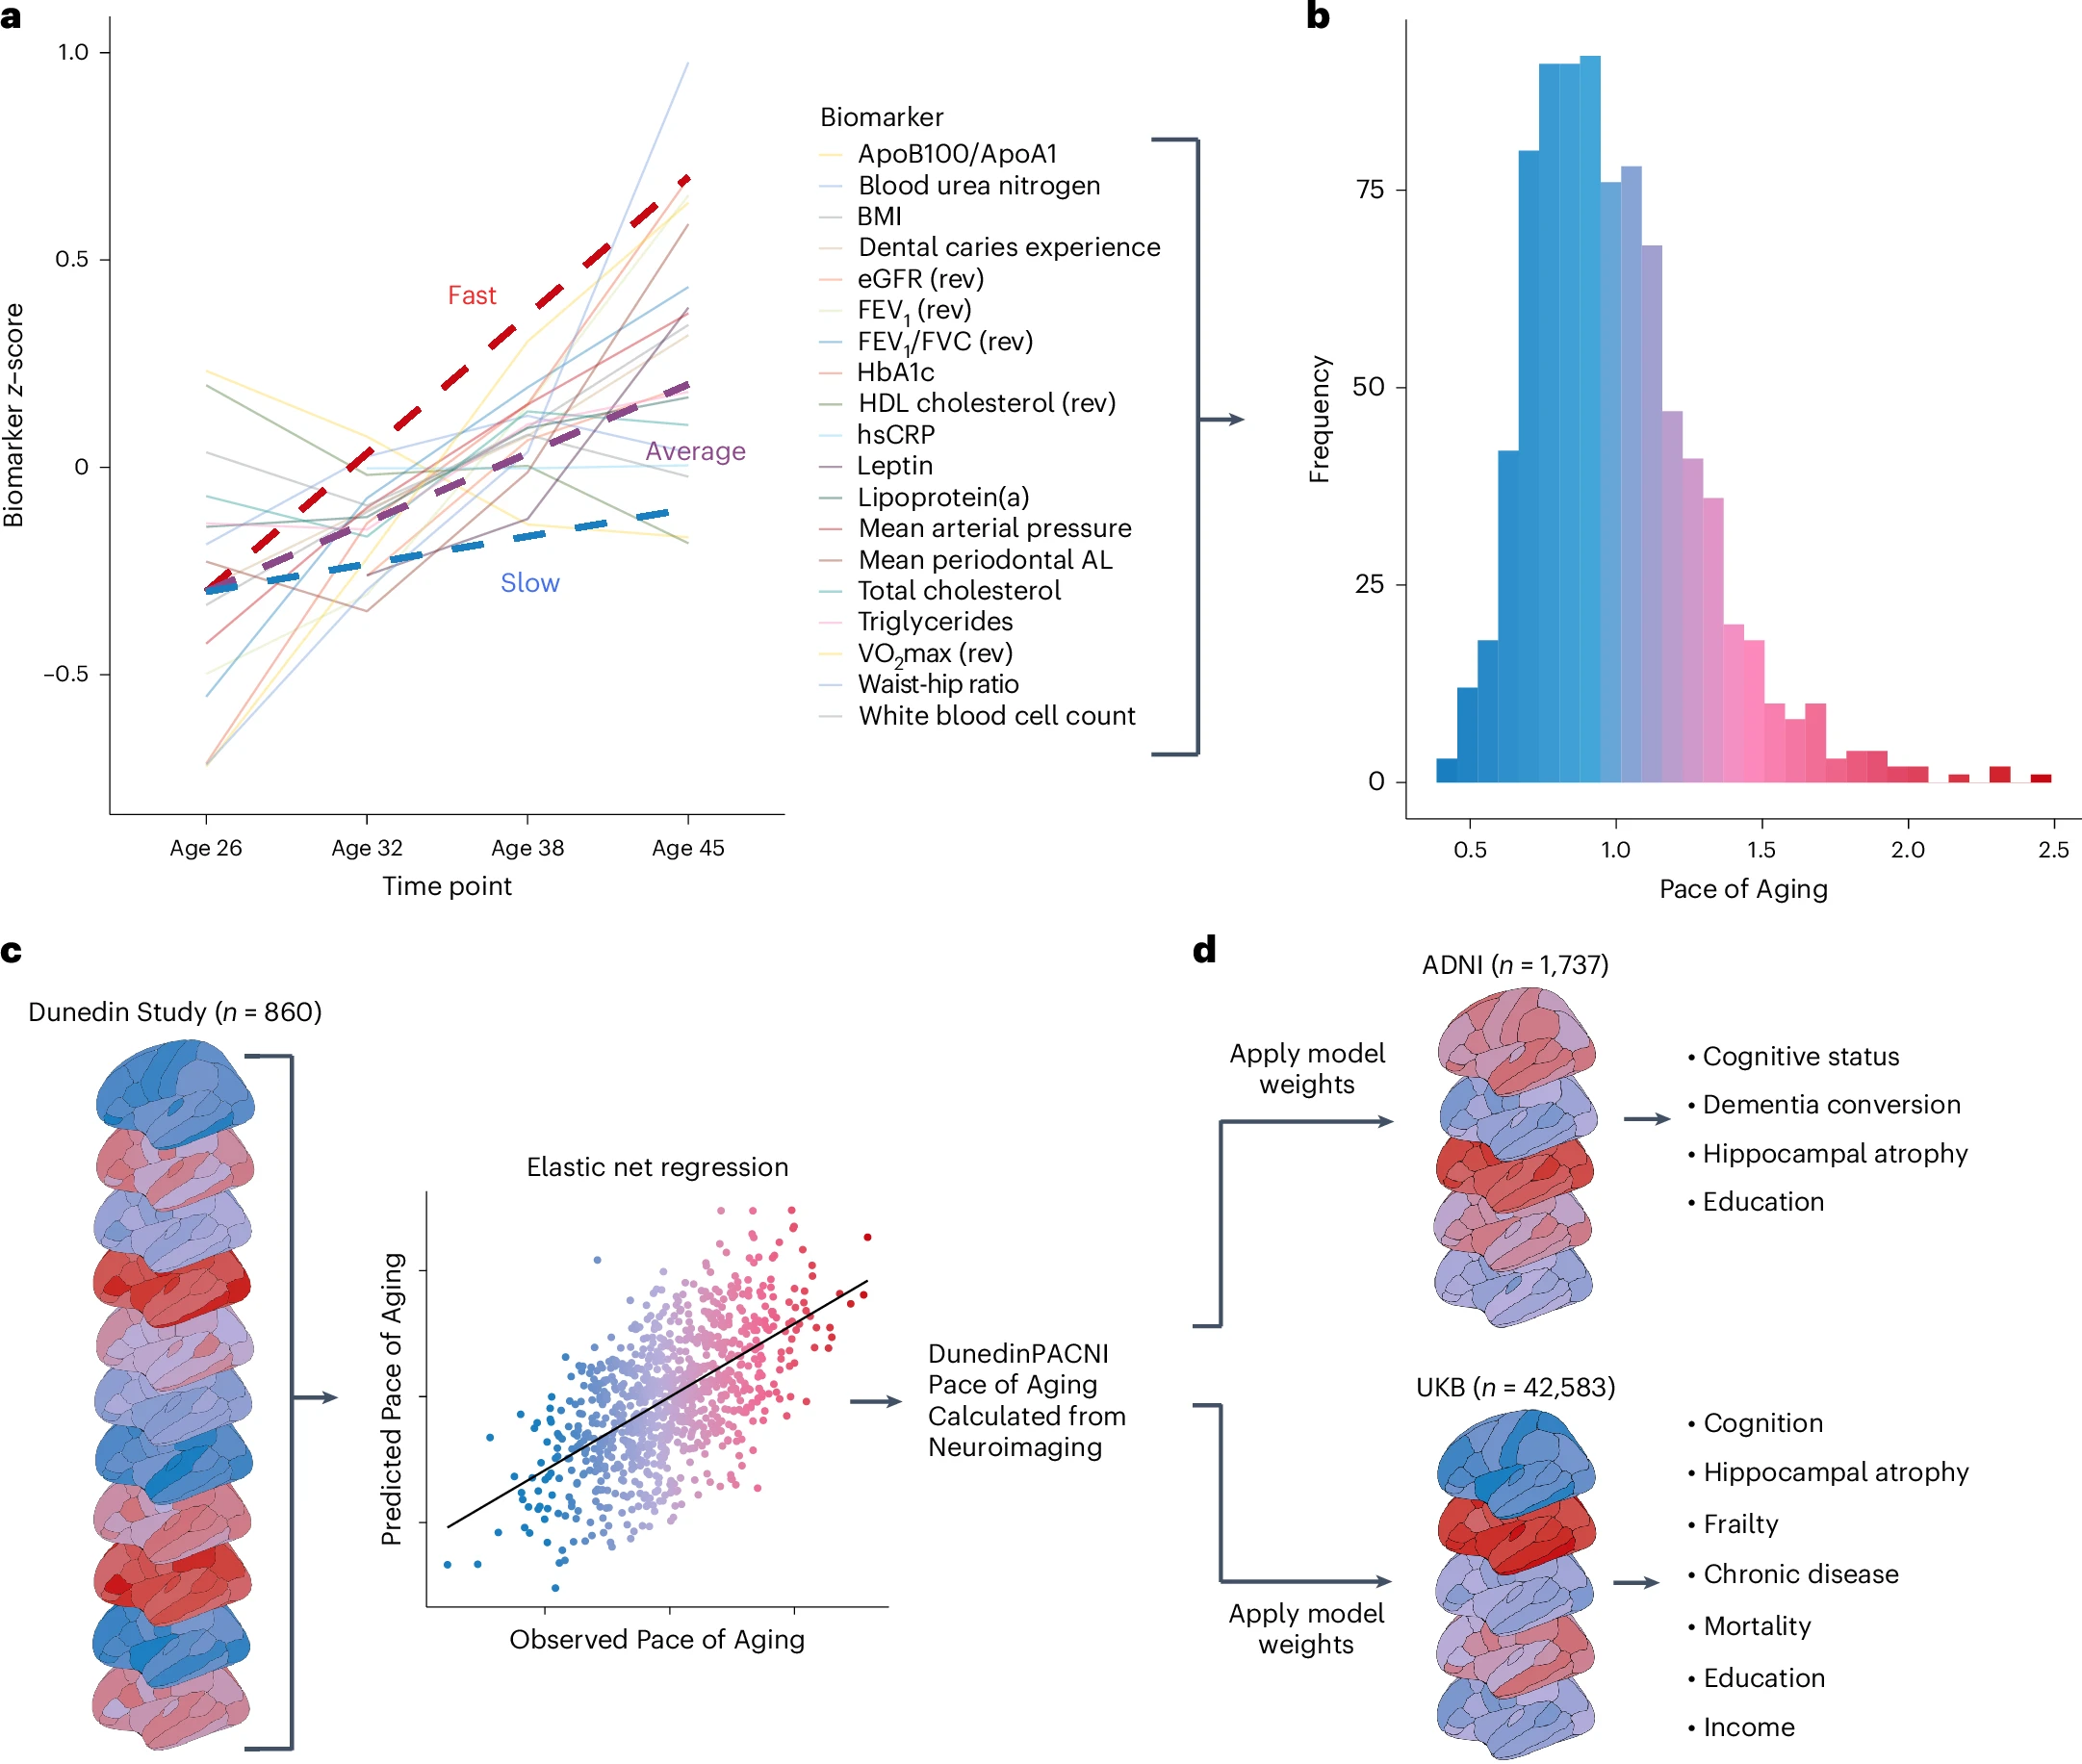
The DunedinPACNI algorithm was designed to predict the longitudinal Pace of Aging phenotype in the Dunedin Study. Briefly, the Pace of Aging phenotype is a composite of decline in 19 biomarkers of 6 organ systems measured longitudinally as the cohort aged from 26 to 45 years old (panel A-B in figure below).
Using brain MRI scans from the Dunedin Study at age 45, we developed an algorithm to accurately estimate the Pace of Aging phenotype among Dunedin Study members (panel C in figure below). Specifically, the algorithm uses FreeSurfer-derived measures of cortical thickness, cortical surface area, cortical gray matter volume, cortical gray-white signal intensity ratio all according to the Desikan-Killiany parcellation and subcortical and cerebellar volumes according to the FreeSurfer ASEG output.
How do we know DunedinPACNI works?
In our recent paper, we exported DunedinPACNI to four external neuroimaging samples (Human Connectome Project, Alzheimer's Disease Neuroimaging Initiative, UK Biobank, and BrainLat) to test the utility of DunedinPACNI in new data. We found that DunedinPACNI has excellent test-retest reliability, is associated with cognition, cognitive impairment, predicts cognitive decline, predicts hippocampal atrophy, predicts chronic disease onset, predicts death, is associated with socioeconomic inequality, and generalizes well in Latin American dementia patients (panel D in figure above).
These analyses are published in our manuscript in Nature Aging.
What do I need to estimate DunedinPACNI?
To estimate DunedinPACNI in new data, you will need brain MRI data parcellated using FreeSurfer. This package can directly read FreeSurfer output into R for FreeSurfer v5, v6, and v7. DunedinPACNI was developed using FreeSurfer v6.0.
If you have data from FreeSurfer v4 or earlier, you might run into bugs due to changes in ROI naming conventions in the newer FreeSurfer versions. To fix this, you can manually format your data into a CSV file to match the newer ROI naming conventions (see section Steps if you do not have complete recon-all FreeSurfer outputs from your dataset).
You also need a CSV file with all participant IDs.
How can I estimate DunedinPACNI?
Below, we provide instructions for estimating DunedinPACNI in two potential scenarios:
- you have access to complete
recon-alloutput from FreeSurfer, likely because you ran FreeSurfer yourself. - you have access to FreeSurfer measures, but you do not have access to the complete FreeSurfer
recon-alloutput. This would likely be because you downloaded FreeSurfer outputs from an open dataset such as ADNI or UK Biobank and have data formatted in a CSV file, or something similar.
You can estimate DunedinPACNI in both cases, but the steps are slightly different.
Steps if you have complete FreeSurfer recon-all outputs for your dataset
Step 1 - installation
First, start by using devtools to install and load the DunedinPACNI package using the following code:
install.packages("devtools")
devtools::install_github("etw11/DunedinPACNI")
library(DunedinPACNI)
Step 2 - participant list
Next, you need to generate a CSV file with all participant IDs that you want to calculate DunedinPACNI scores for. To do this, you could navigate to your FreeSurfer subjects directory and run the following commands into the command line:
echo 'ID' > sublist.csv
ls -d */ >> sublist.csv
The resulting sublist.csv file should look something like this:
ID
<subject 1 ID>
<subject 2 ID>
<subject 3 ID>
...
<subject N ID>
Step 3 - load data into R
Next, you can run the function LoadFreeSurferStats to quickly read the necessary FreeSurfer data into R.
df <- LoadFreeSurferStats(fsdir = '<YOUR FREESURFER SUBJECTS DIRECTORY>',
                          sublist = '<YOUR WORKING DIRECTORY>/sublist.csv')
Where fsdir should be the path to your FreeSurfer subjects directory and sublist is the path to the CSV file with all participant IDs.
This function outputs a data frame of formatted FreeSurfer phenotypes for all subjects.
This function may take a bit of time if you have a lot of data. For example, loading 40,000 scans takes around 1 hour.
LoadFreeSurferStats will throw a warning if there is any missing data and summarize what data are missing (see section What if I am missing estimates for some ROIs?).
Step 4 - estimate DunedinPACNI
Next, you can pass the output from LoadFreeSurferStats directly to ExportDunedinPACNI.
ExportDunedinPACNI(data = df,
                   outdir = '<YOUR WORKING DIRECTORY>')
Where data is the output from LoadFreeSurferStats and outdir is the path to the directory where you want to save DunedinPACNI outputs.
Steps if you do not have complete recon-all FreeSurfer outputs from your dataset
Step 1 - installation
First, start by using devtools to install and load the DunedinPACNI package using the following code:
install.packages("devtools")
devtools::install_github("etw11/DunedinPACNI")
library(DunedinPACNI)
Step 2 - formatting data
Next, you will need to format your data into a CSV file with particular formatting. Specifically, you need to have each row in your CSV file represent a unique scan, and each column with a unique phenotype.
To get a template for this file, run the following commands in R:
data(ROI_names)
write.csv(data.frame(ROI_names), file = '<YOUR WORKING DIRECTORY>/data_file.csv', row.names = FALSE)
This command will output a template CSV file called data_file.csv to the specified directory. You'll need to format your data to match this column order and these column names. It might be helpful to use the ROI_names object in R for data warngling. ROI_names contains the correct naming conventions for each phenotype and is in the correct order. It is loaded automatically when you install the DunedinPACNI package.
Note - If you downloaded FreeSurfer data from an open dataset (e.g. ADNI) you may not have access to gray-white signal intensity ratio measures, as these are not always distributed. If so, see below for now to run this package without gray-white signal intensity ratio (see section What if I am missing gray-white signal intensity ratio measures?).
Step 3 - estimate DunedinPACNI
Once your data is formatted into a CSV with correct order and names, you can load this CSV into R and run ExportDunedinPACNI.
df <- read.csv('<YOUR WORKING DIRECTORY>/data_file.csv')
ExportDunedinPACNI(data = df,
                   outdir = '<YOUR WORKING DIRECTORY>')
Where outdir is the path to the directory where you want to save DunedinPACNI outputs.
Notes
What if I am missing gray-white signal intensity ratio measures?
DunedinPACNI is valid with or without gray-white signal intensity ratio measures. You can choose which version you want to use based on your data availability and preferences.
To estimate DunedinPACNI without gray-white signal intensity ratio, simly set the gwr_missing option to TRUE for both LoadFreeSurferStats and/or ExportDuinedinPACNI. For example, if you are reading FreeSurfer data from the full recon-all output, run:
LoadFreeSurferStats(fsdir = '<YOUR FREESURFER SUBJECTS DIRECTORY>',
                    sublist = '<YOUR WORKING DIRECTORY>/sublist.csv',
                    missing_gwr = TRUE)
Same for ExportDunedinPACNI:
ExportDunedinPACNI(data = df,
                   outdir = '<YOUR WORKING DIRECTORY>',
                   missing_gwr = TRUE)
What if I am missing estimates for some ROIs?
You may have missing data from certain ROIs because of low data quality or lack of availabiliy. If so, we allow users to impute the average score from the Dunedin Study MRI dataset. Each missing ROI will slightly reduce the accuracy of resulting DunedinPACNI scores. Because the same value is being imputed for all subjects, imputed ROIs should have a uniform effect on DunedinPACNI scores in your sample, to avoid affecting within-group comparisons. If you are missing >20% of the ROIs included in the DunedinPACNI algorithm, we think that is too much missingness to estimate DunedinPACNI and ExportDunedinPACNI will throw an error.
If you have a lot of missingness, we would encourage you to consider more sophisticated approaches to imputation. Ultimately, however, how you handle missing data is up to your preferences, the specifics of your data, and your research question.
To run ExportDunedinPACNI with missing ROIs, first make sure columns for those phenotypes are removed from the data frame being passed to ExportDunedinPACNI.
Next, find the naming convention for the missing ROIs using ROI_names. To check this, run these commands in R:
data(ROI_names)
ROI_names
This will output the naming covnentions for all ROIs.
Next, run ExportDunedinPACNI while setting the option missing_ROIs to a text vector of the missing ROI names. In the following example, ExportDunedinPACNI would impute values for right pars operularis gray-white signal intensity ratio and right pars orbitalis gray-white signal intensity ratio.
ExportDunedinPACNI(data = df,
                   outdir = '<YOUR WORKING DIRECTORY>',
                   missing_ROIs = c('GWR_parsopercularis_right', 'GWR_parsorbitalis_right'))
If you have missing ROIs, this may affect the accurac