LogDoctor
Apache2 / Nginx / IIS logs analyzer: parse access logs and view dynamically generated statistics
Install / Use
/learn @elB4RTO/LogDoctorREADME
<br/><br/>
Table of contents
- Overview
- Installation and usage
- Updates
- Before to start
- Logs data
- Statistics
- Extra features
- Final considerations
- Languages
- Contributions
<br/><br/>
Overview
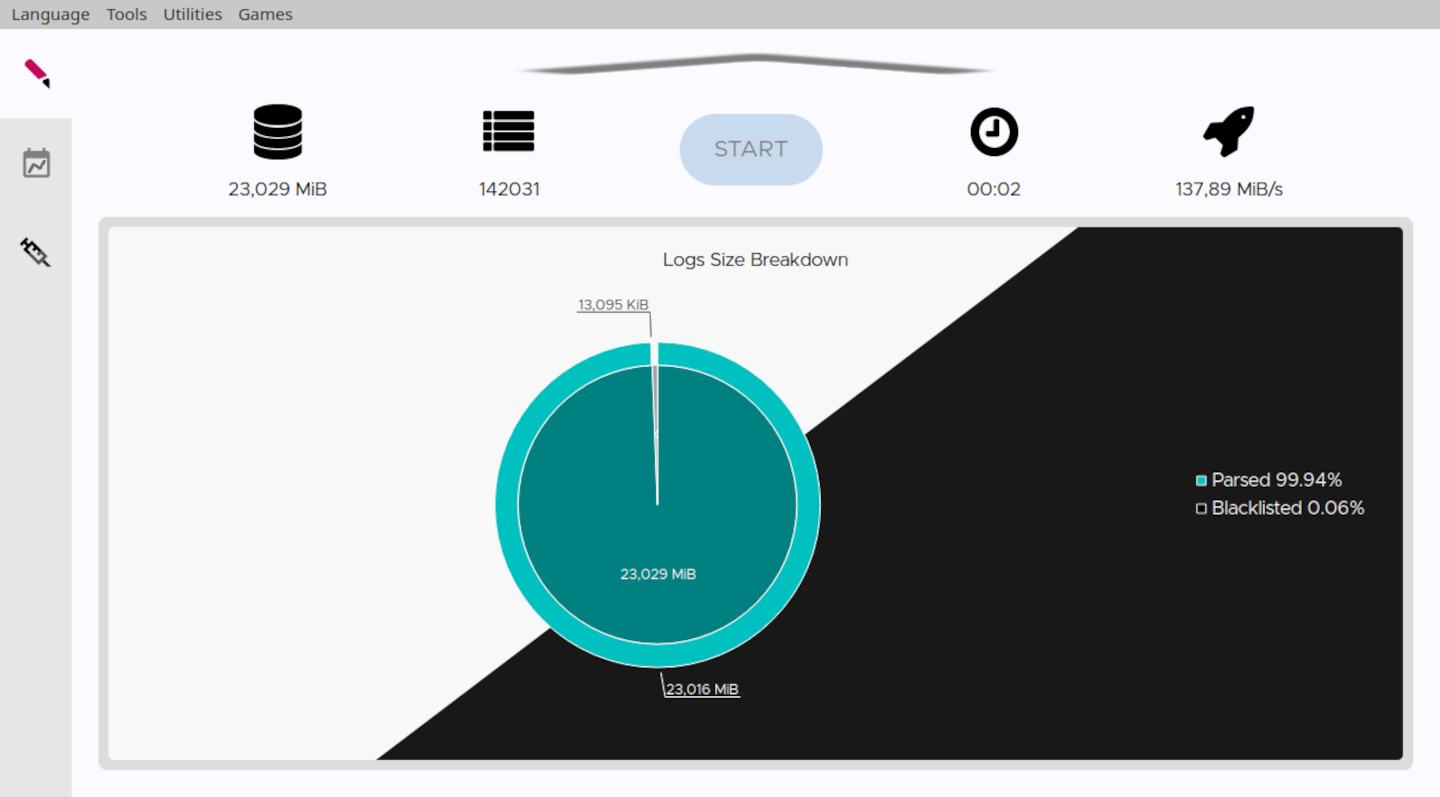
LogDoctor is a web servers' access logs parser which allows to view dynamic satistics of the collected data.<br/> Supported web servers are Apache2, Nginx and IIS.
<br/>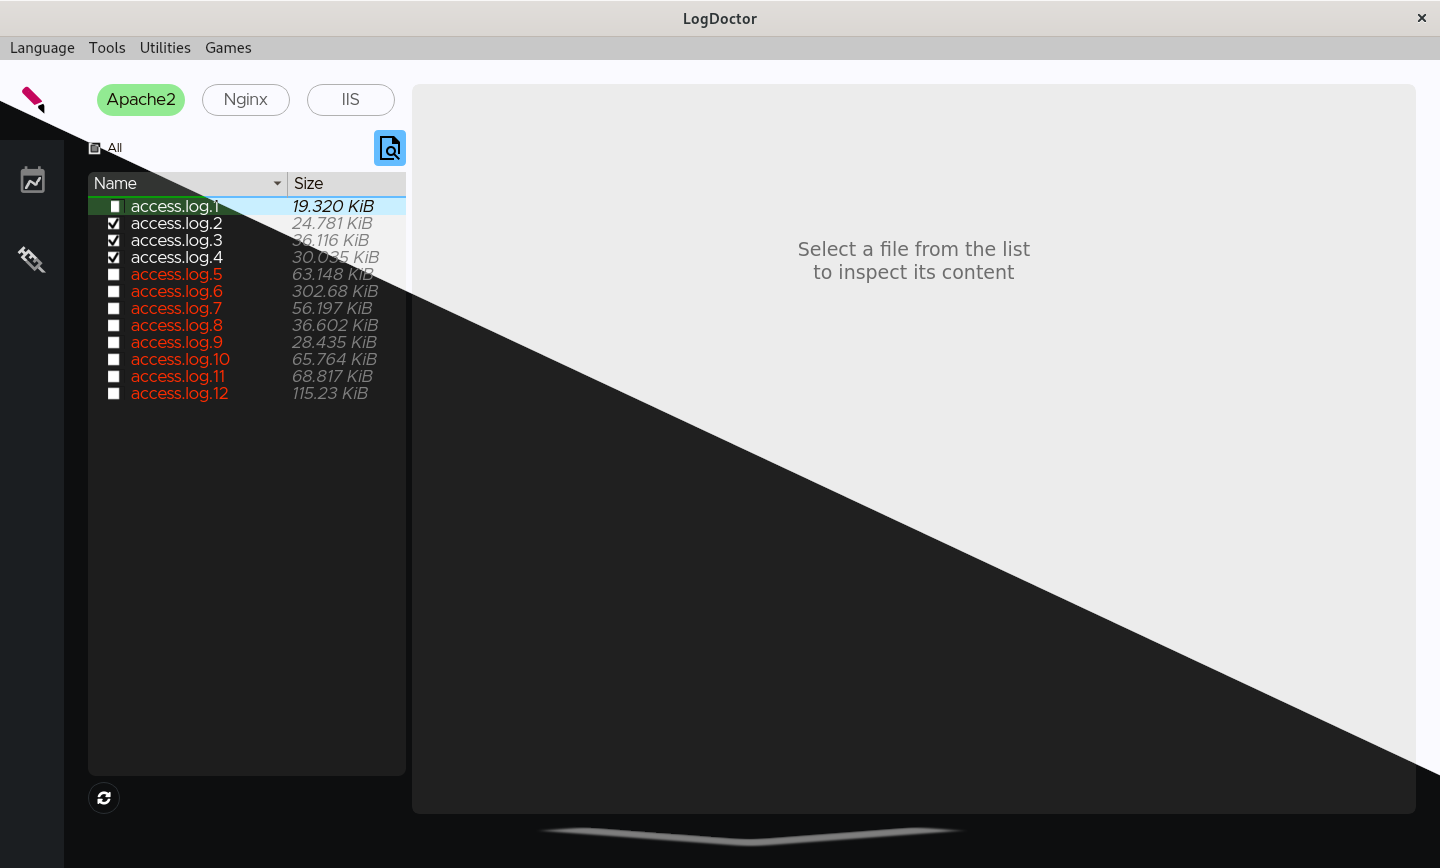
<br/><br/>
LogDoctor is a hard fork of Craplog.
<br/>Installation and usage
Requirements / Dependencies
- From binary:
- C++ 20
- Qt6 (Framework 6.6+, Linguist, Widgets, Charts, Sql, Network)<br/><br/>
- From source:
- all the above
- CMake
- gcc / clang / msvc<br/><br/><br/>
- As Docker:
- Docker<br/><br/>
Usage without installation
-
Download a pre-compiled Release <br/>or<br/> Follow the step-by-step guide in HOW_TO_COMPILE.md
-
Run the executable
Usage with installation
<br/><br/>
How to compile
<br/><br/>
Updates
Version check
To check for updates, open the menu Utilities→Version check.<br/><br/>
How to update
See HOW_TO_UPDATE.md
<br/><br/><br/>
Before to start
When you run LogDoctor for the first time, you will most likely see an empty list of log files.<br/> Head to the configurations section and give a look at least at the logs format settings. Only files containings logs that match the given format will be shown in the list.
<br/><br/>
Logs data
Archived (gzipped) log files can be used as well as normal files.
<br/>Storage
Parsed data will be stored in an SQLite database, which makes it easy to transport/view/edit it as you please.<br/> If LogDoctor's funcionalities aren't enough for your needs, you can always use a DB manager or the SQLite API to make your own queries and retrieve the data you need.
<br/>Examined fields
Not all the available log fields (expecially for Apache2 and Nginx) are taken into consideration.<br/> The considered fields are:
- Date and Time
- Request stuff: Protocol, Method, URI and Query
- Server stuff: Bytes received, Bytes sent and Time taken
- Client stuff: User-agent, IP address, Cookie and Referrer site
Further informations can be found in the wiki or while running LogDoctor.
<br/>Logs options
Various options can be configured about log files.
<br/>Usage control
When you parse a file, it will be hashed using the SHA256 algorithm and the hash will be stored in another database, to keep track of which files you've already used and help you not parsing them twice.<br/>
Note
The SHA256 algorithm produces an irreversible hash, which means that no information about the file can be retrieved from the hash.<br/> LogDoctor will never grab and/or use any information about you or the usage you make of it.
<br/>Logs path
A different logs path can be used for any of the three supported Web Servers.<br/> It can be the default system folder or any folder you decide to use, just set it in the options.
<br/>Logs format
Before to start parsing logs, you must set-up the loga format.<br/>
Head to the configurations section, under Logs select the Web Server you want to configure and tap Format.<br/>
Once inside the Format section, you can insert the log format string you're using. Don't forget to use the Generete preview button to generate a log line sample and check the correctness of the format!<br/>
For reliability reasons, LogDoctor does not support the usage of the Carriage Return inside the log format string.
<br/>Apache2
The log format string must be specified. Any format is supported, if valid.<br/> To retrieve your format string:
- open the configuration file
/etc/apache2/apache2.conf - usually, the line you're looking for is the one starting with
LogFormatand ending withcombined. It should be somewhere near to the end of the file. - you must not paste the whole line, just the part holding the format string.<br/>
Example:<br/>
- this is the whole line:<br/>
LogFormat "%h %l %u %t \"%r\" %>s %b \"%{Referer}i\" \"%{User-agent}i\"" combined - this is the format string:<br/>
please notice that you have to remove the enclosing quotes/apostrophes as well<br/>%h %l %u %t \"%r\" %>s %b \"%{Referer}i\" \"%{User-agent}i\"
- this is the whole line:<br/>
More informations can be found in the wiki or while setting the format.
<br/>Nginx
The log format string must be specified. Any format is supported, if valid.<br/> To retrieve your format string:<br/>
- open the configuration file
/usr/local/etc/nginx/nginx.conf - usually, the line you're looking for is the one starting with
log_format main. It should be somwehere in the middle of the file - one important thing: don't paste the indentations and new lines! The default line is usualy declared in consecutive lines, and indented. You must reduce it to a one consecutive string (by also removing the apostrophes in the middle of it). The best way is to do this job inside the configuration file, then save and restart Nginx to see if any error is thrown.<br/>
Example:
- this is the whole line:<br/>
log_format main '$remote_addr - $remote_user [$time_local] ' '"$request" $status $body_bytes_sent ' '"$http_referer" "$http_user_agent" "$gzip_ratio"'; - this is the resulting format string:<br/>
please notice that you have to remove the enclosing apostrophes/quotes as well<br/>$remote_addr - $remote_user [$time_local] "$request" $status $bytes_sent "$http_referer" "$http_user_agent" "$gzip_ratio"
- this is the whole line:<br/>
More informations can be found in the wiki or while setting the format.
<br/>IIS
Supported log formats are: W3C, NCSA and IIS.<br/>
The NCSA and IIS modules doesn't allow any modification from the user, so nothing more have to be specified.
The W3C module instead allows the user to decide which fields to log, and thus you must declare the log format string you're using. To retrieve your format string (for the W3C module only):
- open any of the log files which have been generated by this module
- the line you're looking for is the one starting with
#Fields:, usually at the beginning of the file.<br/> Example:<br/>- this is the whole line:<br/>
#Fields: date time s-ip cs-method cs-uri-stem cs-uri-query s-port cs-username c-ip cs(User-Agent) cs(Referer) sc-status sc-substatus sc-win32-status time-taken - this is the format string:<br/>
date time s-ip cs-method cs-uri-stem cs-uri-query s-port cs-username c-ip cs(User-Agent) cs(Referer) sc-status sc-substatus sc-win32-status time-taken
- this is the whole line:<br/>
More informations can be found in the wiki or while setting the format.
<br/><br/>
Blacklist
You can add elements to the blacklist to avoid storing the lines containing those elements.
Each web server has its own list.
<br/>Warnlist
As for the blacklist, you can add elements to the warnlist.<br/> Warnlists will mark with a warning the lines triggering them. Warnings can be viewed in the
Related Skills
node-connect
353.3kDiagnose OpenClaw node connection and pairing failures for Android, iOS, and macOS companion apps
frontend-design
111.7kCreate distinctive, production-grade frontend interfaces with high design quality. Use this skill when the user asks to build web components, pages, or applications. Generates creative, polished code that avoids generic AI aesthetics.
openai-whisper-api
353.3kTranscribe audio via OpenAI Audio Transcriptions API (Whisper).
qqbot-media
353.3kQQBot 富媒体收发能力。使用 <qqmedia> 标签,系统根据文件扩展名自动识别类型(图片/语音/视频/文件)。
