OrgChart.js
It's a simple and direct organization chart plugin. Anytime you want a tree-like chart, you can turn to OrgChart.
Install / Use
/learn @dabeng/OrgChart.jsREADME

jQuery version
Web Components version
Vue.js Version
Angular Version
React Version
Foreword
- First of all, thanks a lot for wesnolte's great work:blush: -- jOrgChart. The thought that using nested tables to build out the tree-like orgonization chart is amazing. This idea is more simple and direct than its counterparts based on svg.
- Unfortunately, it's long time not to see the update of jOrgChart. on the other hand, I got some interesting ideas to add, so I choose to create a new repo.
- Font Awesome provides us with administration icon, second level menu icon and loading spinner.
Features
- Supports both local data and remote data (JSON).
- Smooth expand/collapse effects based on CSS3 transitions.
- Align the chart in 4 orientations.
- Allows user to change orgchart structure by drag/drop nodes.
- Allows user to edit orgchart dynamically and save the final hierarchy as a JSON object.
- Supports exporting chart as a picture.
- Supports pan and zoom
- Users can adopt multiple solutions to build up a huge organization chart(please refer to multiple-layers or hybrid layout sections)
- touch-enabled plugin for mobile divice
Getting started
Build
npm install
gulp build
Serve
gulp serve
Now, you can try out all the demos on http://localhost:3000.
Note: your nodejs version should be 4+.
Demo
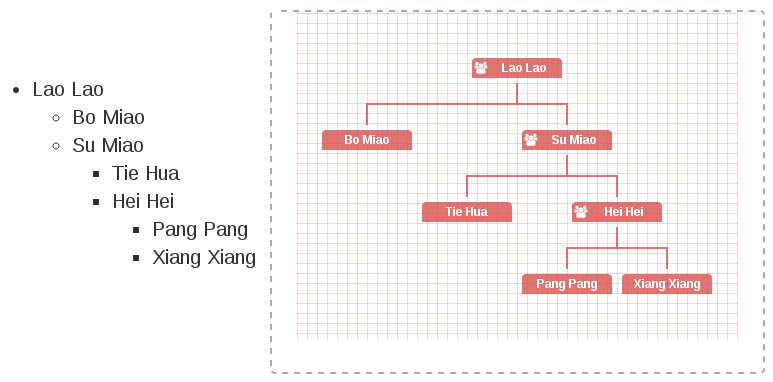
- using ul datasource(this feature comes from Tobyee's good idea:blush:)
<!-- wrap the text node with <a href="#"> , <span>, blabla is also OK. Note:text node must immediately follow the <li> tag, with no intervening characters of any kind.  -->
<ul id="ul-data">
  <li>Lao Lao
    <ul>
      <li>Bo Miao</li>
      <li>Su Miao
        <ul>
          <li>Tie Hua</li>
          <li>Hei Hei
            <ul>
              <li>Pang Pang</li>
              <li>Xiang Xiang</li>
            </ul>
          </li>
        </ul>
      </li>
    </ul>
  </li>
</ul>
let orgchart = new OrgChart({
  'chartContainer': '#chart-container',
  'data' : '#ul-data'
});
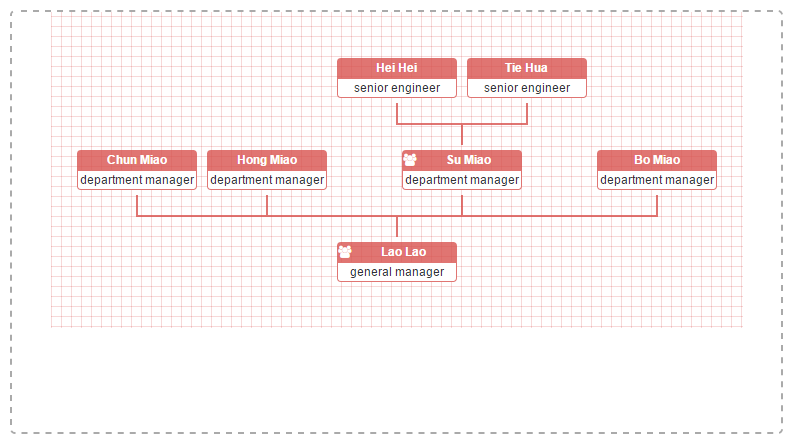
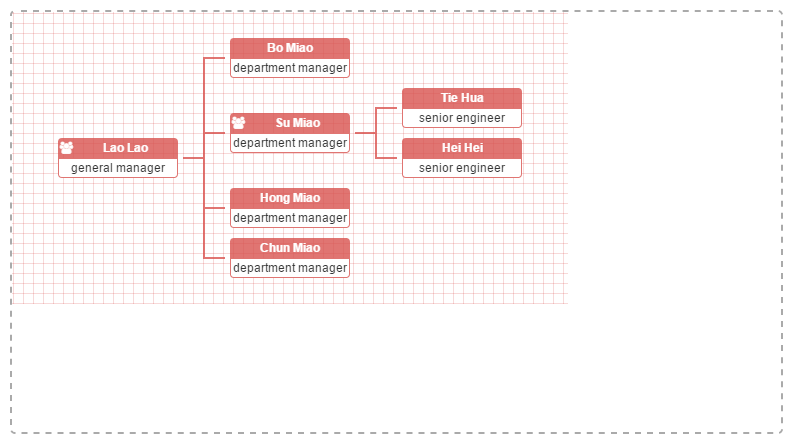
let datascource = {
  'name': 'Lao Lao',
  'title': 'general manager',
  'children': [
    { 'name': 'Bo Miao', 'title': 'department manager' },
    { 'name': 'Su Miao', 'title': 'department manager',
      'children': [
        { 'name': 'Tie Hua', 'title': 'senior engineer' },
        { 'name': 'Hei Hei', 'title': 'senior engineer',
          'children': [
            { 'name': 'Pang Pang', 'title': 'engineer' },
            { 'name': 'Xiang Xiang', 'title': 'UE engineer' }
          ]
        }
      ]
    },
    { 'name': 'Yu Jie', 'title': 'department manager' },
    { 'name': 'Yu Li', 'title': 'department manager' },
    { 'name': 'Hong Miao', 'title': 'department manager' },
    { 'name': 'Yu Wei', 'title': 'department manager' },
    { 'name': 'Chun Miao', 'title': 'department manager' },
    { 'name': 'Yu Tie', 'title': 'department manager' }
  ]
},
orgchart = new OrgChart({
  'chartContainer': '#chart-container',
  'data' : datascource,
  'depth': 2,
  'nodeContent': 'title'
});
-
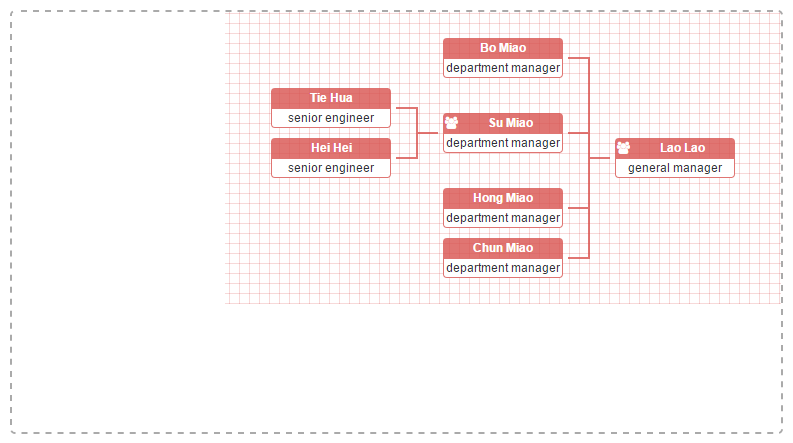
I wanna align orgchart with different orientation(this feature comes from the good idea of fvlima and badulesia :blush:)
Top to Bottom -- default direction, as you can see all other examples on this page.
// sample of core source code
let orgchart = new OrgChart({
  'chartContainer': '#chart-container',
  'data' : datascource,
  'nodeContent': 'title',
  'direction': 'b2t'
});
// sample of core source code
let orgchart = new OrgChart({
  'chartContainer': '#chart-container',
  'data' : datascource,
  'nodeContent': 'title',
  'direction': 'l2r'
});
// sample of core source code
let orgchart = new OrgChart({
  'chartContainer': '#chart-container',
  'data' : datascource,
  'nodeContent': 'title',
  'direction': 'r2l'
});
// sample of core source code
let orgchart = new OrgChart({
  'chartContainer': '#chart-container',
  'data' : datascource,
  'nodeContent': 'title',
  'toggleSiblingsResp': true
});
// sample of core source code
let orgchart = new OrgChart({
  'chartContainer': '#chart-container',
  'data' : '/orgchart/initdata',
  'depth': 2,
  'nodeContent': 'title'
});
Note: when users use ajaxURL option to build orghchart, they must use json datasource(both local and remote are OK) and set the relationship property of datasource by themselves. All of these staff are used to generate the correct expanding/collapsing arrows for nodes.
// sample of core source code
let datascource = {
  'id': '1',
  'name': 'Su Miao',
  'title': 'department manager',
  'relationship': '111',
  'children': [
    { 'id': '2','name': 'Tie Hua', 'title': 'senior engineer', 'relationship': '110' },
    { 'id': '3','name': 'Hei Hei', 'title': 'senior engineer', 'relationship': '111' }
  ]
},
ajaxURLs = {
  'children': '/orgchart/children/',
  'parent': '/orgchart/parent/',
  'siblings': function(nodeData) {
    return '/orgchart/siblings/' + nodeData.id;
  },
  'families': function(nodeData) {
    return '/orgchart/families/' + nodeData.id;
  }
},
orgchart = new OrgChart({
  'chartContainer': '#chart-container',
  'data' : datascource,
  'ajaxURL': ajaxURLs,
  'nodeContent': 'title',
  'nodeId': 'id'
});
// sample of core source code
let orgchart = new OrgChart({
  'chartContainer': '#chart-container',
  'data' : datascource,
  'depth': 2,
  'nodeContent': 'title',
  'nodeID': 'id',
  'createNode': function(node, data) {
    let secondMenuIcon = document.createElement('i'),
      secondMenu = document.createElement('div');

    secondMenuIcon.setAttribute('class', 'fa fa-info-circle second-menu-icon');
    secondMenuIcon.addEventListener('click', (event) => {
      event.target.nextElementSibling.classList.toggle('hidden');
    });
    secondMenu.setAttribute('class', 'second-menu hidden');
    secondMenu.innerHTML = `<img class="avatar" src="../img/avatar/${data.id}.jpg">`;
    node.appendChild(secondMenuIcon)
    node.appendChild(secondMenu);
  }
});
Here, we need the help from html2canvas.
// sample of core source code
let orgchart = new OrgChart({
  'chartContainer': '#chart-container',
  'data' : datascource,
  'depth': 2,
  'nodeContent': 'title',
  'exportButton': true,
  'exportFilename': 'MyOrgChart'
});
Here, we fall back on OpenLayers. It's the most aewsome open-source js library for Web GIS you sholdn't miss.
// sample of core source code
let map = new ol.Map({
  layers: [
    new ol.layer.Tile({
      source: new ol.source.Stamen({
        layer: 'watercolor'
      }),
      preload: 4
    }),
    new ol.layer.Tile({
      source: new ol.source.Stamen({
        layer: 'terrain-labels'
      }),
      preload: 1
    })
  ],
  target: 'pageBody',
  view: new ol.View({
    center: ol.proj.transform([-87.6297980, 41.8781140], 'EPSG:4326', 'EPSG:3857'),
    zoom: 10
  })
});

document.body.insertBefore(document.querySelector('#chart-container'), map.getViewport());

let datascource = {
  'name': 'Lao Lao',
  'title': 'President Office',
  'position': [-87.6297980, 41.8781140],
  'children': [
    { 'name': 'Bo Miao', 'title': 'Administration  Dept.', 'position': [-83.0457540, 42.3314270]},
        { 'name': 'Su Miao', 'title': 'R & D Dept.', 'position': [-81.6943610, 41.4993200]},
        { 'name': 'Yu Jie', 'title': 'Product Dept.', 'position': [-71.0588800, 42.3600820]},
        {
