Traceshark
This is a tool for Linux kernel ftrace and perf events visualization
Install / Use
/learn @cunctator/TracesharkREADME

1. Introduction to Traceshark
This is a graphical viewer for the Ftrace and Perf events that can be captured by the Linux kernel. It visualizes the following events:
cpu_frequency
cpu_idle
sched_migrate_task
sched_process_exit
sched_process_fork
sched_switch
sched_wakeup
sched_wakeup_new
sched_waking
The sched_waking events are not really visualized but there is a button to find the sched_waking event that has instigated a particular sched_wakeup event.
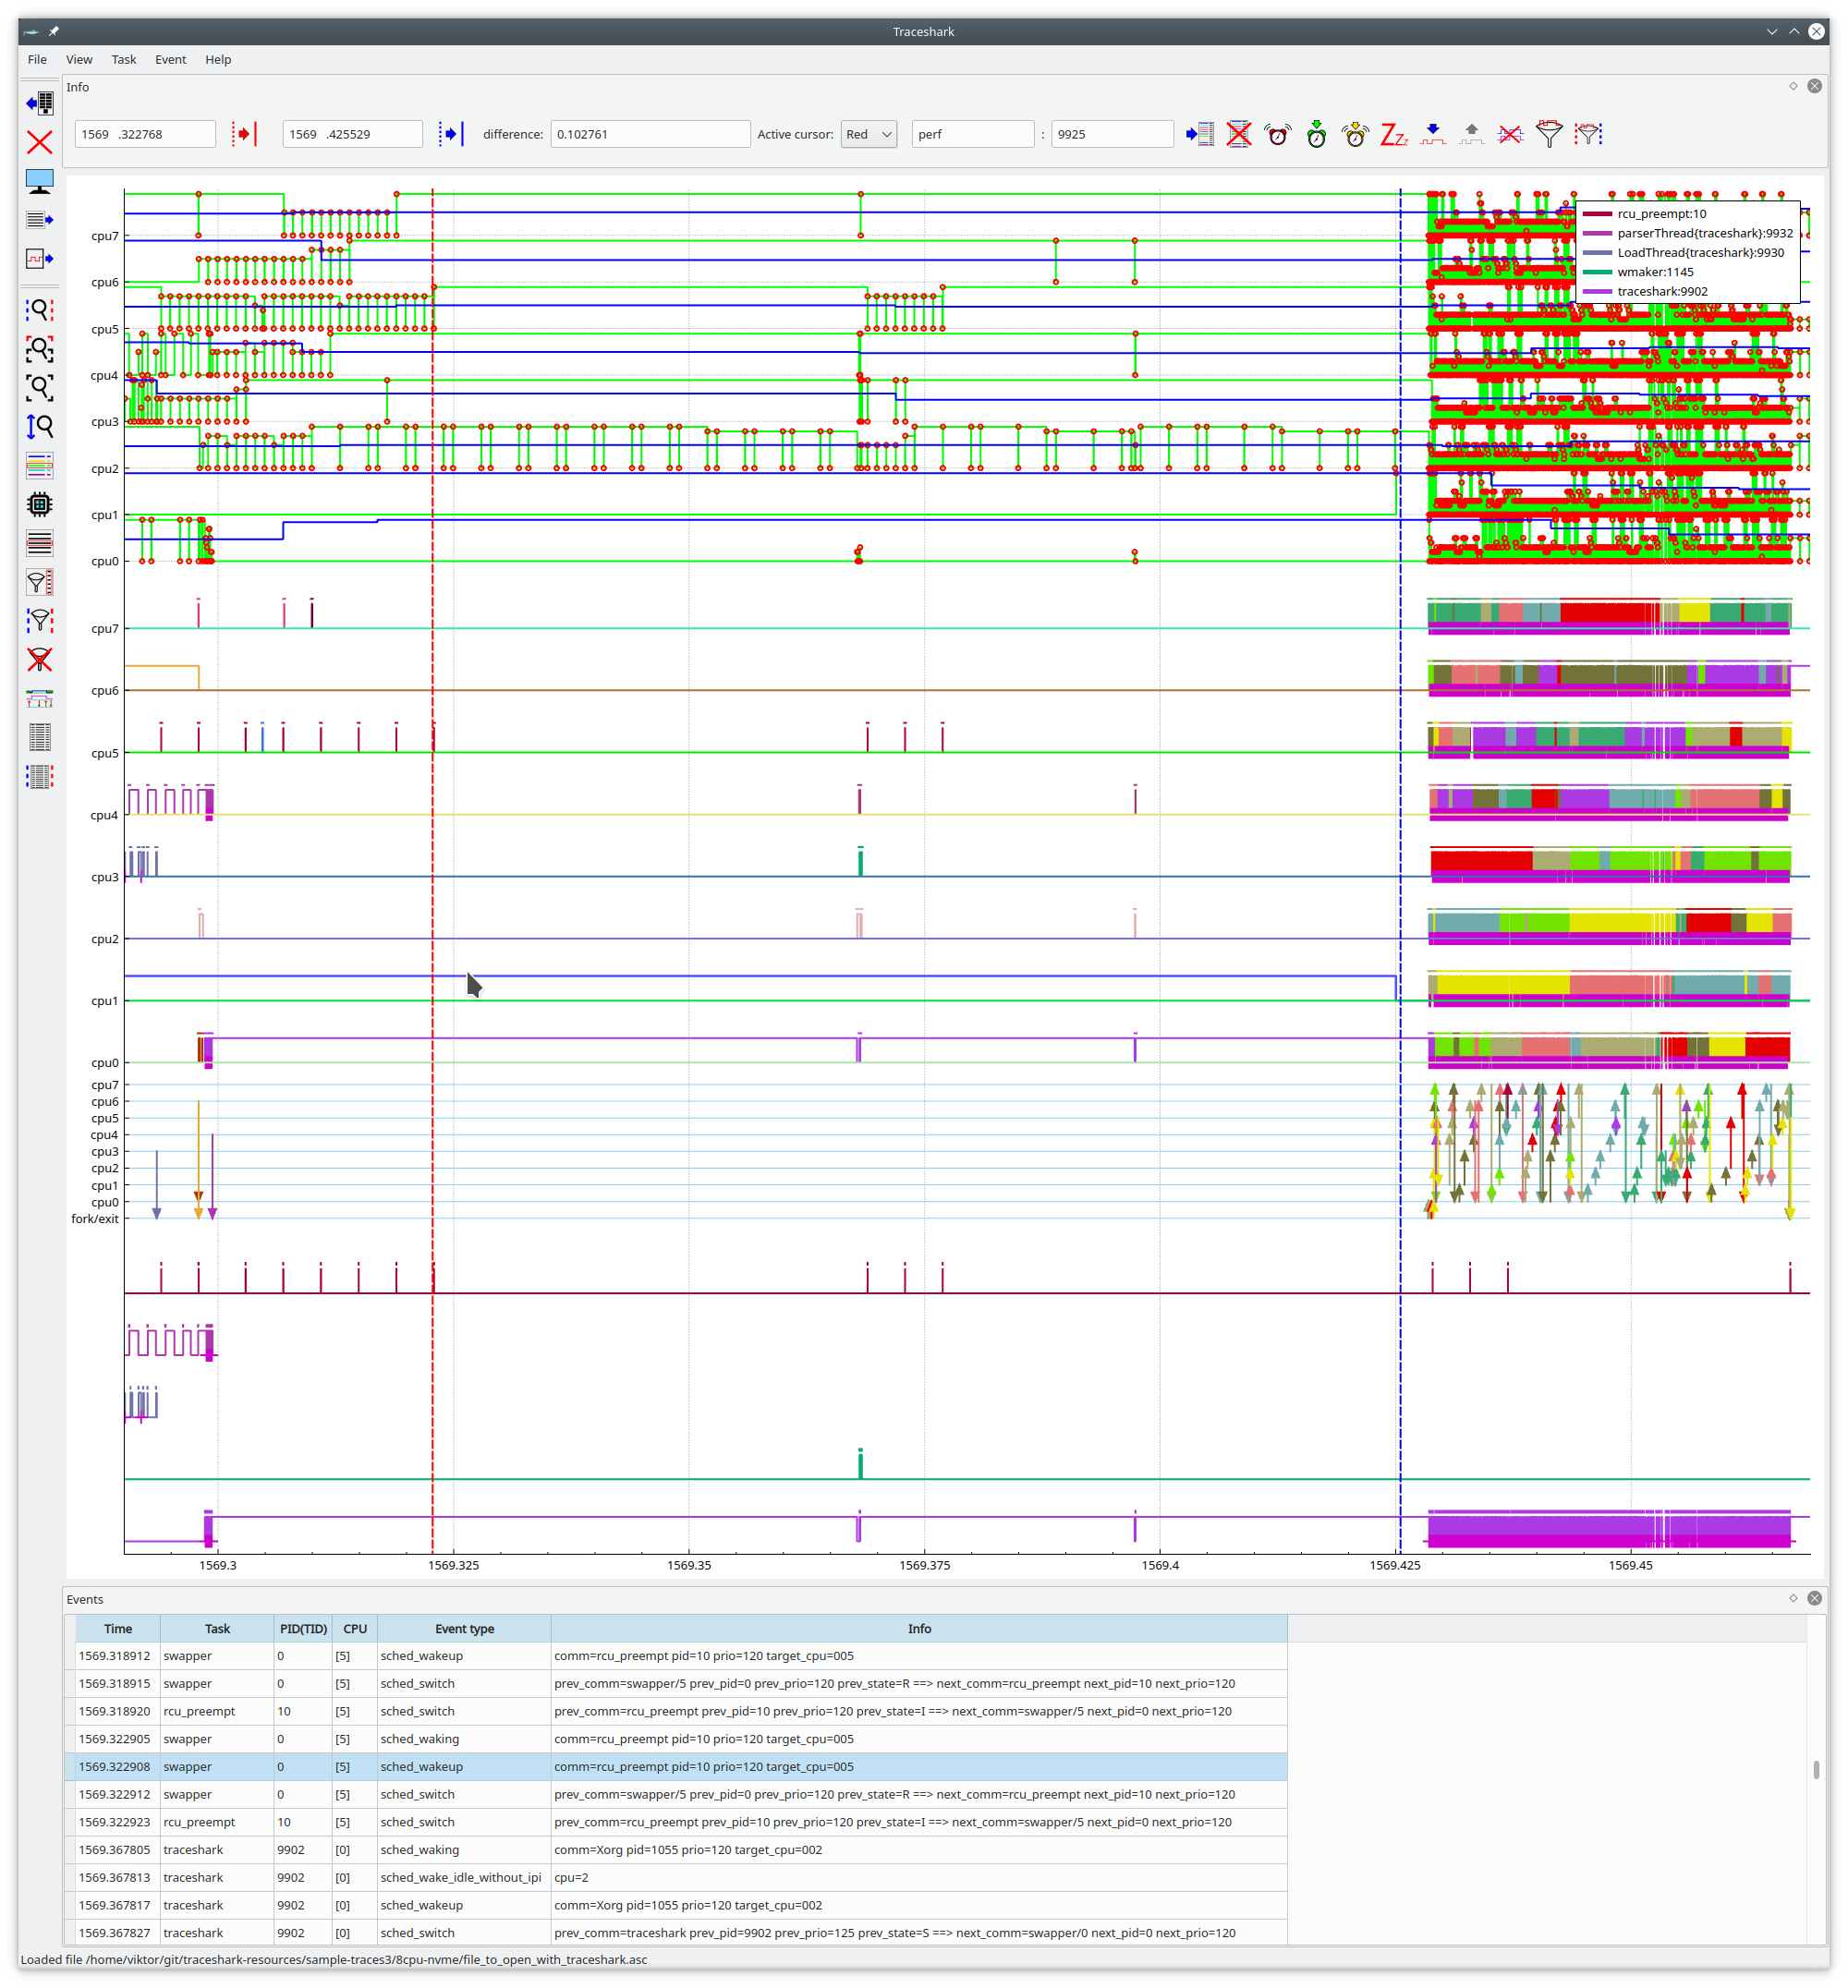
Above is a screenshot of traceshark. The eight uppermost graphs are for displaying CPU idle and frequency states. They are eight because the measurement was made on a system with eight virtual CPUs. The green graphs with red circles  show the CPU idle states while the thicker blue graphs
  show the CPU frequency changes.
Below these eight graphs are the per CPU scheduling graphs, the different colors of these graphs are for different tasks. The small vertical bars that are shown just above the per CPU graphs indicates the waiting time between a task becoming runnable and being scheduled, the highest height is equal to 20 ms, i.e. a full length means that the waiting time was at least 20 ms, possibly more.
Furthermore, in the scheduling graphs, there are the following subtle markers:
 The blue triangle indicates that the task was still running when it was scheduled out.
 The red triangle indicates that the task was preempted when it was scheduled out.
 The magenta colored plus sign indicates that the task went into uninterruptible sleep when it was scheduled out. Note that in practice, only the lower line of the plus sign is visible.
Below the scheduling graphs are the migration graphs. Task migrations between CPUs are shown with arrows. Fork/exit is shown with an arrow from/to fork/exit.
Below the migration arrows are the unified task graphs, where tasks are shown without caring about which CPU it is running on. Here the time between becoming runnable and being scheduled in shown by horizontal bars.
These graphs will only be shown if requested by the user. It is necessary to select a task and click the  button or the
 Add a unified graph button in the task select dialog.
The task select dialog can be shown by clicking View -> Show task list, or by clicking the dedicated  button for it on the left panel.
1.1 Brief summary of the functionality of the GUI
1.1.1 How to zoom and scroll vertically
The graphs are by default zoomed and scrolled horizontally, i.e. time wise. You can scroll by grabbing the graph with your mouse pointer and zoom with the mouse wheel.
If you instead want to zoom or scroll vertically, you need to toggle the  button.
Another option is to select the vertical axis by left clicking on it with your mouse pointer. N.B, you should click directly on the line representing the axis, not on the labels, such as "cpu0", "cpu1", etc. As long as the vertical axis is selected, all scrolling and zooming will be vertical. If you want to switch back to horizontal, then you just need to deselect the axis by clicking on it again. Vertical zooming and scrolling may be particularly useful if you are looking at a trace of a system with a large number of CPUs or if you are short of vertical screen space.
1.1.2 Functionality of the menus
The items in the menus are in general duplicated as buttons. However, there is one exception, those that are in the Event menu.
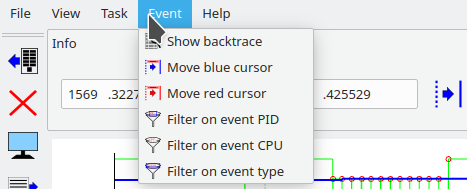
Above is a screenshot of the Event menu. For these items, there are no push buttons in the GUI. However, these actions can also be triggered by double clicking on the corresponding column of the currently selected event in the events view. Below is a brief explanation of these menu items:

Show backtrace: Shows a dialog window containing the backtrace of the currently selected event. The backtrace dialog window will look somewhat like this: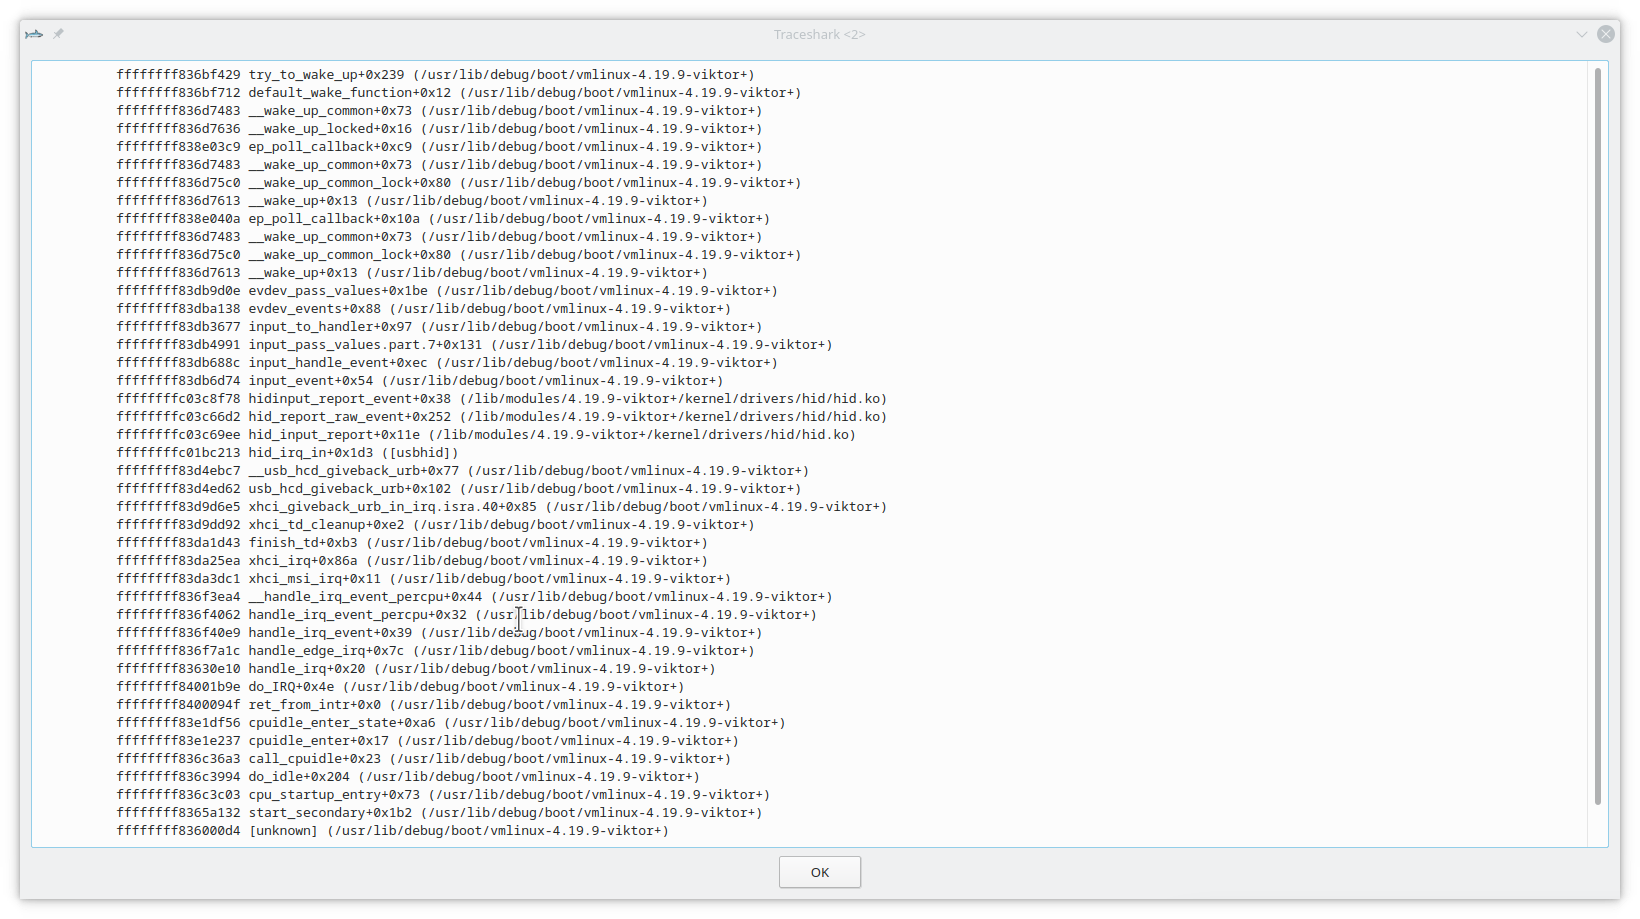

Move blue cursor: Move the blue cursor to the time of the selected event.
Move red cursor: Move the red cursor to the time of the selected event.
Filter on event PID: Filter the events view on the PID of the selected event.
Filter on event CPU: Filter the events view on the CPU of the selected event.
Filter on event type: Filter the events view on the type of the selected event.
1.1.3 Functionality of the buttons
There are a number of buttons in the GUI. These buttons are also duplicated in the menus. Here is a description of the buttons in the left panel:
 This button is used to open a trace file.
 Closes the currently open trace.
 Take a screenshot of the plot and save it to a file.
- Show the task select dialog. This makes it possible to filter the events view by task, to show a task in the legend, or to show a unified graph. This button is very useful when the user knows the name of a task of interest but cannot find it easily among the scheduling graphs.
 Show a list of CPUs and it's possible to filter the events view by CPU.
 Show a list of the different event types and it's possible to filter the events view by event type.
 Show a dialog that lets the user input one or several regular expressions and it is possible to filter the events view with these. The filtering only applies to what is in the Info field. The filtering is separately applied to the different words, which are delimited by spaces. The filtering will by default try with all words but it is also possible to select a certain position. The position may be from the start or from the match of the previous regular expression.
 This will filter the events view so that only events in the interval between the cursors are displayed.
 This button resets all filters.
 Opens a dialog that allows the filtered events to be saved to a file. The output format is more or less the same as from perf, so that if one has filtered on the
 cyclesevents, it's possible to generate a CPU Flame Graph with the tools here, or [here](https:
Related Skills
node-connect
342.5kDiagnose OpenClaw node connection and pairing failures for Android, iOS, and macOS companion apps
frontend-design
85.3kCreate distinctive, production-grade frontend interfaces with high design quality. Use this skill when the user asks to build web components, pages, or applications. Generates creative, polished code that avoids generic AI aesthetics.
openai-whisper-api
342.5kTranscribe audio via OpenAI Audio Transcriptions API (Whisper).
qqbot-media
342.5kQQBot 富媒体收发能力。使用 <qqmedia> 标签,系统根据文件扩展名自动识别类型(图片/语音/视频/文件)。