Chronon
Chronon is a data platform for serving for AI/ML applications.
Install / Use
/learn @airbnb/ChrononREADME
Chronon: A Data Platform for AI/ML
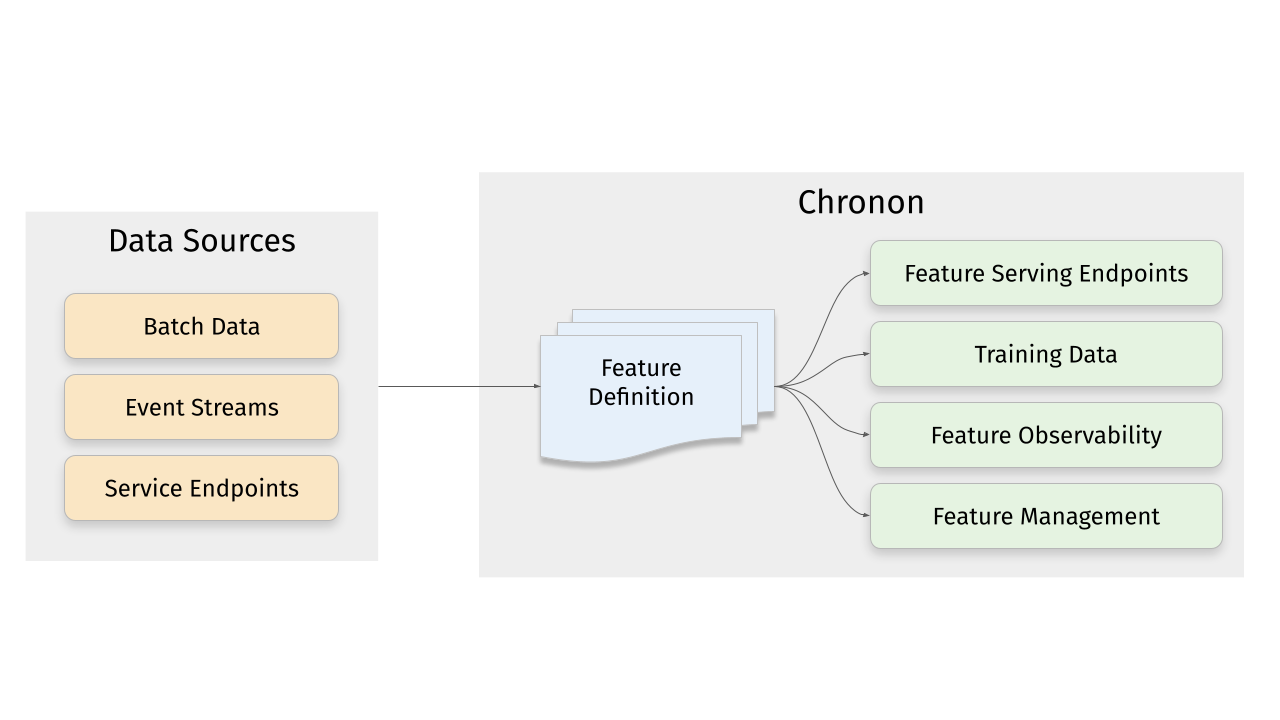
Chronon is a platform that abstracts away the complexity of data computation and serving for AI/ML applications. Users define features as transformation of raw data, then Chronon can perform batch and streaming computation, scalable backfills, low-latency serving, guaranteed correctness and consistency, as well as a host of observability and monitoring tools.
It allows you to utilize all of the data within your organization, from batch tables, event streams or services to power your AI/ML projects, without needing to worry about all the complex orchestration that this would usually entail.
More information about Chronon can be found at chronon.ai.
Platform Features
Online Serving
Chronon offers an API for realtime fetching which returns up-to-date values for your features. It supports:
- Managed pipelines for batch and realtime feature computation and updates to the serving backend
- Low latency serving of computed features
- Scalable for high fanout feature sets
Backfills
ML practitioners often need historical views of feature values for model training and evaluation. Chronon's backfills are:
- Scalable for large time windows
- Resilient to highly skewed data
- Point-in-time accurate such that consistency with online serving is guaranteed
Observability, monitoring and data quality
Chronon offers visibility into:
- Data freshness - ensure that online values are being updated in realtime
- Online/Offline consistency - ensure that backfill data for model training and evaluation is consistent with what is being observed in online serving
Complex transformations and windowed aggregations
Chronon supports a range of aggregation types. For a full list see the documentation here.
These aggregations can all be configured to be computed over arbitrary window sizes.
Quickstart
This section walks you through the steps to create a training dataset with Chronon, using a fabricated underlying raw dataset.
Includes:
- Example implementation of the main API components for defining features -
GroupByandJoin. - The workflow for authoring these entities.
- The workflow for backfilling training data.
- The workflows for uploading and serving this data.
- The workflow for measuring consistency between backfilled training data and online inference data.
Does not include:
- A deep dive on the various concepts and terminologies in Chronon. For that, please see the Introductory documentation.
- Running streaming jobs.
Requirements
- Docker
Setup
To get started with the Chronon, all you need to do is download the docker-compose.yml file and run it locally:
curl -o docker-compose.yml https://chronon.ai/docker-compose.yml
docker-compose up
Once you see some data printed with a only showing top 20 rows notice, you're ready to proceed with the tutorial.
Introduction
In this example, let's assume that we're a large online retailer, and we've detected a fraud vector based on users making purchases and later returning items. We want to train a model that will be called when the checkout flow commences and predicts whether this transaction is likely to result in a fraudulent return.
Raw data sources
Fabricated raw data is included in the data directory. It includes four tables:
- Users - includes basic information about users such as account created date; modeled as a batch data source that updates daily
- Purchases - a log of all purchases by users; modeled as a log table with a streaming (i.e. Kafka) event-bus counterpart
- Returns - a log of all returns made by users; modeled as a log table with a streaming (i.e. Kafka) event-bus counterpart
- Checkouts - a log of all checkout events; this is the event that drives our model predictions
Start a shell session in the Docker container
In a new terminal window, run:
docker-compose exec main bash
This will open a shell within the chronon docker container.
Chronon Development
Now that the setup steps are complete, we can start creating and testing various Chronon objects to define transformation and aggregations, and generate data.
Step 1 - Define some features
Let's start with three feature sets, built on top of our raw input sources.
Note: These python definitions are already in your chronon image. There's nothing for you to run until Step 3 - Backfilling Data when you'll run computation for these definitions.
Feature set 1: Purchases data features
We can aggregate the purchases log data to the user level, to give us a view into this user's previous activity on our platform. Specifically, we can compute SUMs COUNTs and AVERAGEs of their previous purchase amounts over various windows.
Because this feature is built upon a source that includes both a table and a topic, its features can be computed in both batch and streaming.
source = Source(
    events=EventSource(
        table="data.purchases", # This points to the log table with historical purchase events
        topic=None, # Streaming is not currently part of quickstart, but this would be where you define the topic for realtime events
        query=Query(
            selects=select("user_id","purchase_price"), # Select the fields we care about
            time_column="ts") # The event time
    ))

window_sizes = [Window(length=day, timeUnit=TimeUnit.DAYS) for day in [3, 14, 30]] # Define some window sizes to use below

v1 = GroupBy(
    sources=[source],
    keys=["user_id"], # We are aggregating by user
    aggregations=[Aggregation(
            input_column="purchase_price",
            operation=Operation.SUM,
            windows=window_sizes
        ), # The sum of purchases prices in various windows
        Aggregation(
            input_column="purchase_price",
            operation=Operation.COUNT,
            windows=window_sizes
        ), # The count of purchases in various windows
        Aggregation(
            input_column="purchase_price",
            operation=Operation.AVERAGE,
            windows=window_sizes
        ) # The average purchases by user in various windows
    ],
)
See the whole code file here: purchases GroupBy. This is also in your docker image. We'll be running computation for it and the other GroupBys in Step 3 - Backfilling Data.
Feature set 2: Returns data features
We perform a similar set of aggregations on returns data in the returns GroupBy. The code is not included here because it looks similar to the above example.
Feature set 3: User data features
Turning User data into features is a littler simpler, primarily because there are no aggregations to include. In this case, the primary key of the source data is the same as the primary key of the feature, so we're simply extracting column values rather than performing aggregations over rows:
source = Source(
    entities=EntitySource(
        snapshotTable="data.users", # This points to a table that contains daily snapshots of the entire product catalog
        query=Query(
            selects=select("user_id","account_created_ds","email_verified"), # Select the fields we care about
        )
    ))

v1 = GroupBy(
    sources=[source],
    keys=["user_id"], # Primary key is the same as the primary key for the source table
    aggregations=None # In this case, there are no aggregations or windows to define
)
Taken from the users GroupBy.
Step 2 - Join the features together
Next, we need the features that we previously defined backfilled in a single table for model training. This can be achieved using the Join API.
For our use case, it's very important that features are computed as of the correct timestamp. Because our model runs when the checkout flow begins, we'll want to be sure to use the corresponding timestamp in our backfill, such that features values for model training logically match what the model will see in online inference.
Join is the API that drives feature backfills for training data. It primarilly performs the following functions:
- Combines many features together into a wide view (hence the name
Join). - Defines the primary keys and timestamps for which feature backfills should be performed. Chronon can then guarantee that feature values are correct as of this timestamp.
- Performs scalable backfills.
Here is what our join looks like:
source = Source(
    events=EventSource(
        table="data.checkouts",
        query=Query(
            selects=select("user_id"), # The primary key used to join various GroupBys together
            time_column="ts",
            ) # The event time used to compute feature values as-of
    ))

v1 = Join(
    left=source,
    right_parts=[JoinPart(group_by=group_by) for group_by in [purchases_v1, refunds_v1, users]] # Include the three GroupBys
)
Taken from the training_set Join.
The left side of the join is what defines the timestamps and primary keys for the backfill (notice that it is built on top of the checkout event, as dictated by our use case).
Note that this Join combines the above three GroupBys into one data definition. In the next step, we'll run the command to execute com
Related Skills
node-connect
350.1kDiagnose OpenClaw node connection and pairing failures for Android, iOS, and macOS companion apps
frontend-design
109.9kCreate distinctive, production-grade frontend interfaces with high design quality. Use this skill when the user asks to build web components, pages, or applications. Generates creative, polished code that avoids generic AI aesthetics.
openai-whisper-api
350.1kTranscribe audio via OpenAI Audio Transcriptions API (Whisper).
qqbot-media
350.1kQQBot 富媒体收发能力。使用 <qqmedia> 标签,系统根据文件扩展名自动识别类型(图片/语音/视频/文件)。
