PyCurve
PyCurve : Python Yield Curve is a package created in order to interpolate yield curve, create parameterized curve and create stochastic simulation.
Install / Use
/learn @ahgperrin/PyCurveREADME
![]()
PyCurve - Python Yield Curve Toolkit
What is it ?
PyCurve is a Python package that provides to user high level yield curve usefull tool. For example you can istanciate a Curve and get a d_rate, a discount factor, even forward d_rate given multiple methodology from Linear Interpolation to parametrization methods as Nelson Siegel or Bjork-Christenssen. PyCurve is also able to provide solutions in order to build yield curve or price Interest rates derivatives via Vasicek or Hull and White.
Features
Below this is the features that this package tackle :
- Curve Smoothing:
- Create Curve Object with two numpy array (t,rt)
- Linear interpolation given a Curve
- Cubic interpolation given a Curve
- Nelson Siegel and Svensson model creation and components plotting
- Nelson Siegel and Svensson calibration given a Curve
- Bjork Christensen and Augmented (6 factors) model creation and components plotting
- Stochastic Modelling:
- Vasicek Model Simulation
- Hull and White one factor Model Simulation
How to install
From pypi
pip install PyCurve
From pypi specific version
pip install PyCurve==0.0.5
From Git
git clone https://github.com/ahgperrin/PyCurve.git
pip install -e .
Objects
Curve Object
This object consists in a simple yield curve encapsulation. This object is used by others class to encapsulate results or in order to directly create a curve with data obbserved in the market.
| Attributes | Type | Description | | :----------:|:--------| :-------------------------------------------| | rt | Private | Interest rates as float in a numpy.ndarray | | t | Private | Time as float or int in a numpy.ndarray |
| Methods | Type | Description | Return | :------------------:|:--------| :-------------------------| :----------| | get_rate | Public | rt getter | _rt | | get_time | Public | rt getter | _t | | set_rate | Public | rt getter | None | | set_time | Public | rt getter | None | | is_valid_attr(attr) | Private | Check attributes validity | attribute | | plot_curve() | Public | Plot Yield curve | None |
Example
from PyCurve.curve import Curve
time = np.array([0.25, 0.5, 0.75, 1., 2.,
        3., 4., 5., 10., 15.,
        20.,25.,30.])
rate = np.array([-0.63171, -0.650322, -0.664493, -0.674608, -0.681294,
        -0.647593, -0.587828, -0.51251, -0.101804,  0.182851,
        0.32962,0.392117,  0.412151])
curve = Curve(rate,time)
curve.plot_curve()
print(curve.get_rate)
print(curve.get_time)
[ 0.25  0.5   0.75  1.    2.    3.    4.    5.   10.   15.   20.   25.
 30.  ]

[-0.63171  -0.650322 -0.664493 -0.674608 -0.681294 -0.647593 -0.587828
 -0.51251  -0.101804  0.182851  0.32962   0.392117  0.412151]

Simulation Object
This object consists in a simple simulation encapsulation. This object is used by others class to encapsulate results of monte carlo simulation. This Object has build in method that could perform the conversion from a simulation to a yield curve or to a discount factor curve.
| Attributes | Type | Description | | :----------:|:--------| :------------------------------------------------| | sim | Private | Simulated paths matrix numpy.ndarray | | dt | Private | delta_time as float or int in a numpy.ndarray |
| Methods | Type | Description & Params | Return |
|-------------------------------|---------|-----------------------------------------------------------------------------|--------------|
| get_sim | Public | sim getter | _rt |
| get_nb_sim | Public | nb_sim getter | sim.shape[0] |
| get_steps | Public | steps getter | sim.shape[1] |
| get_dt | Public | dt getter | _dt |
| is_valid_attr(attr) | Private | Check attributes validity | attribute |
| yield_curve() | Public | Create a yield curve from simulated paths | Curve |
| discount_factor() | Public | Convert d_rate simulation to discount factor | np.ndarray |
| plot_discount_curve(average) | Public | Plot discount factor (average :bool False plot all paths True Plot estimate)| None |
| plot_simulation() | Public | Plot Yield curve | None |
| plot_yield_curve() | Public | Plot Yield curve | None |
| plot_model() | Public | Plot Yield curve | None |
Example
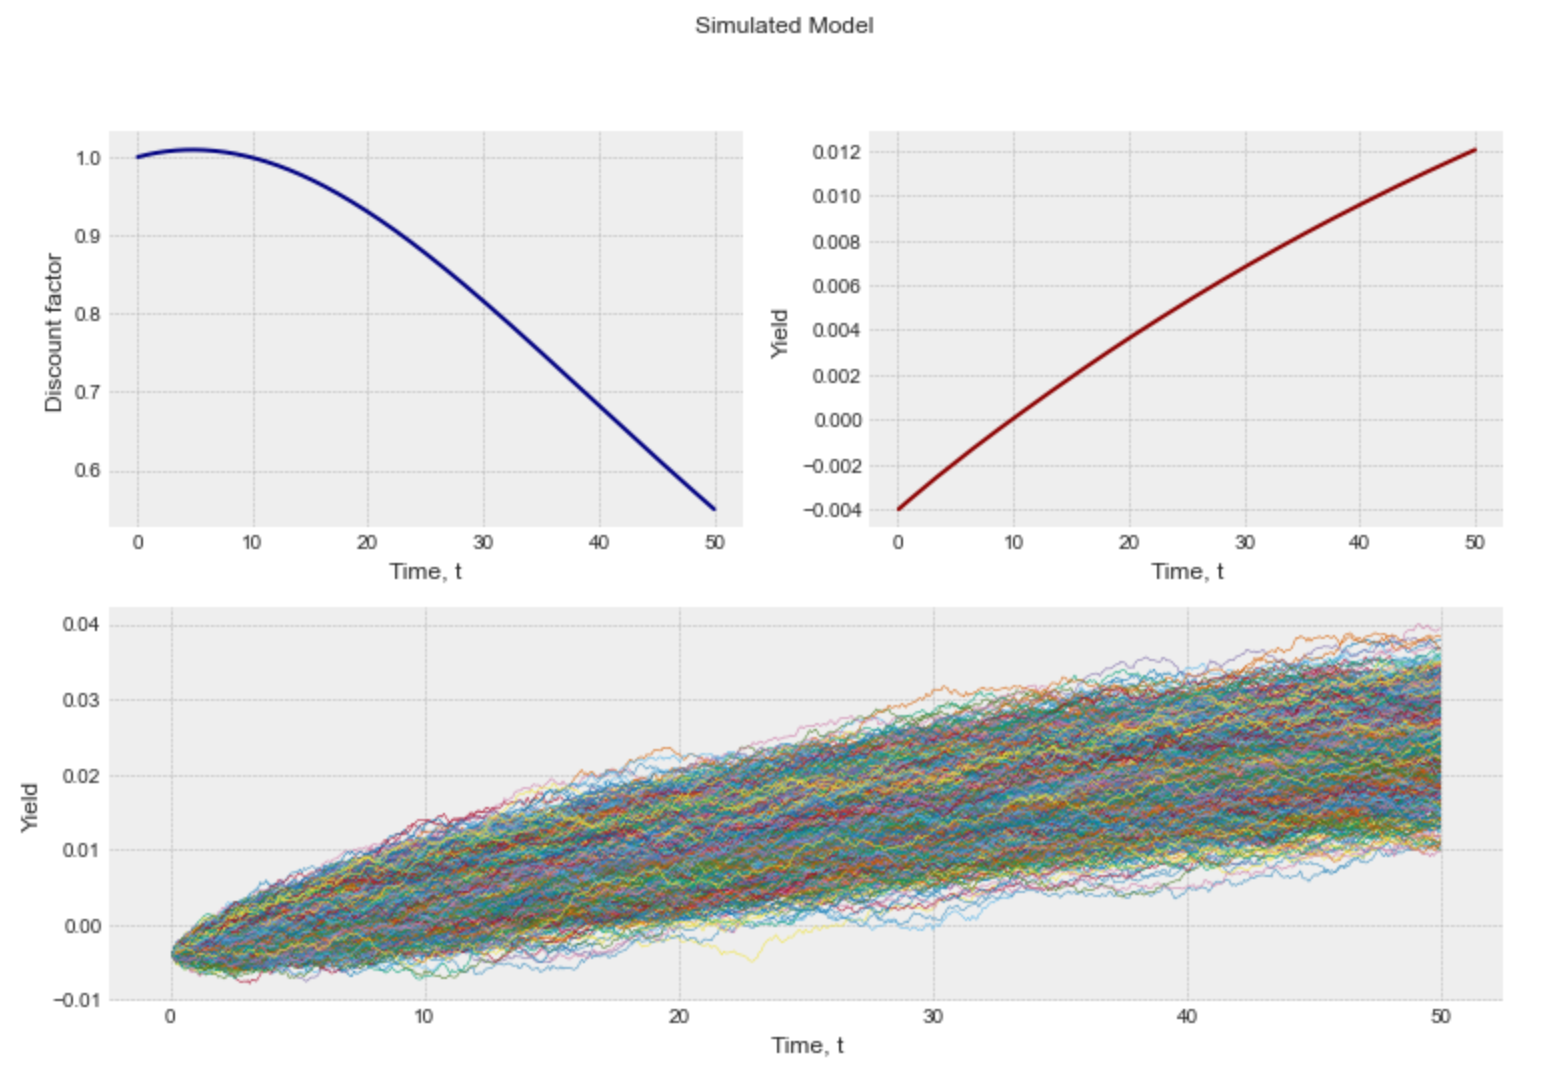
Using Vasicek to Simulate
from PyCurve.vasicek import Vasicek
vasicek_model = Vasicek(0.02, 0.04, 0.001, -0.004, 50, 30 / 365)
simulation = vasicek_model.simulate_paths(2000) #Return a Simulation and then we can apply Simulation Methods
simulation.plot_yield_curve()

simulation.plot_model()
Yield Curve Construction Tools
This section is the description with examples of what you can do with this package Please note that for all the examples in this section curve is referring to the curve below you can see example regarding Curve Object in the dedicated section.
from PyCurve import Curve
time = np.array([0.25, 0.5, 0.75, 1., 2.,
        3., 4., 5., 10., 15.,
        20.,25.,30.])
d_rate = np.array([-0.63171, -0.650322, -0.664493, -0.674608, -0.681294,
        -0.647593, -0.587828, -0.51251, -0.101804,  0.182851,
        0.32962,0.392117,  0.412151])
curve = Curve(time,d_rate)
linear
Interpolate any d_rate from a yield curve using linear interpolation. THis module is build using scipy.interpolate
| Attributes | Type | Description | | :----------:|:--------| :------------------------------------------------ | | curve | Private | Curve Object to be intepolated | | func_rate | Private | interp1d Object used to interpolate |
| Methods | Type | Description & Params | Return |
|-------------------------------|---------|-----------------------------------------------------------------------------|--------------|
| d_rate(t) | Public | d_rate interpolation t: float, array,int | float |
| df_t(t) | Public | discount factor interpolation t: float, array,int | float |
| forward(t1,t2) | Public | forward d_rate between t1 and t2 t1,t2: float, array,int | float |
| create_curve(t_array) | Public | create a Curve object for t values t:array | Curve |
| is_valid_attr(attr) | Private | Check attributes validity | attribute |
Example
from PyCurve.linear import LinearCurve
linear_curve = LinearCurve(curve)
print("7.5-year d_rate : "+str(linear_curve.d_rate(7.5)))
print("7.5-year discount d_rate : "+str(linear_curve.df_t(7.5)))
print("Forward d_rate between 7.5 and 12.5 years : "+str(linear_curve.forward(7.5,12.5)))
7.5-year d_rate : -0.307157
7.5-year discount d_rate : 1.0233404498400862
Forward d_rate between 7.5 and 12.5 years : 0.5620442499999999
cubic
Interpolate any d_rate from a yield curve using linear interpolation. THis module is build using scipy.interpolate
| Attributes | Type | Description | | :----------:|:--------| :------------------------------------------------ | | curve | Private | Curve Object to be intepolated | | func_rate | Private | PPoly Object used to interpolate |
| Methods | Type | Description & Params | Return |
|-------------------------------|---------|-----------------------------------------------------------------------------|--------------|
| d_rate(t) | Public | d_rate interpolation t: float, array,int | float |
| df_t(t) | Public | discount factor interpolation t: float, array,int | float |
| forward(t1,t2) | Public | forward d_rate between t1 and t2 t1,t2: float, array,int
