Covid19pandas
COVID-19 data as pandas dataframes. Built-in plotting functions. Tutorials in our docs.
Install / Use
/learn @PayneLab/Covid19pandasREADME
covid19pandas
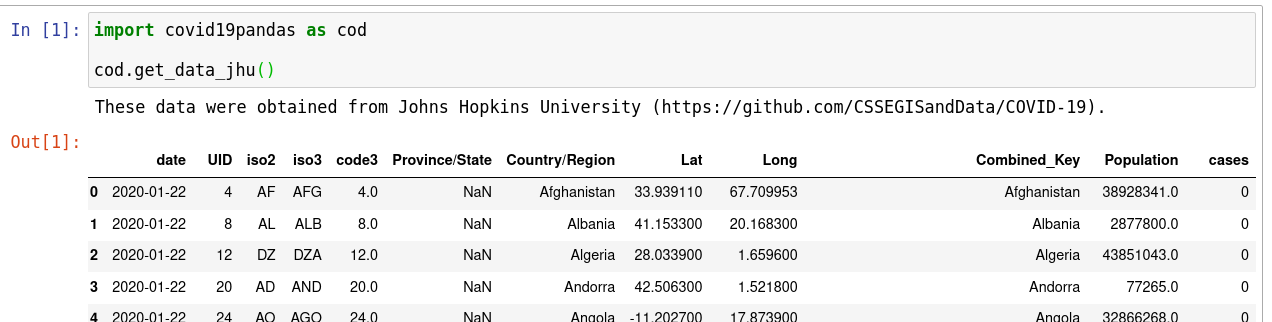
This package presents COVID-19 data from Johns Hopkins University and The New York Times in pandas dataframes, to make analysis and visualization easier in a Python environment.
We provide this resource because it is important for anyone to be able to easily access data. Nevertheless, you should always follow the COVID-19 safety protocols established by authorities in your area rather than relying on any conclusions you may divine from these data about the state of the world. Established guidelines often include staying home as much as possible, avoiding contact with people outside your household, washing your hands frequently, and wearing a mask in public.
For some great insights on problems that exist with COVID-19 data, as well as other things to consider when working with these data, read this article.
Installation
Install the package via pip: pip install covid19pandas
Usage
After importing the package, you can quickly access data with a simple function call:
Tutorials
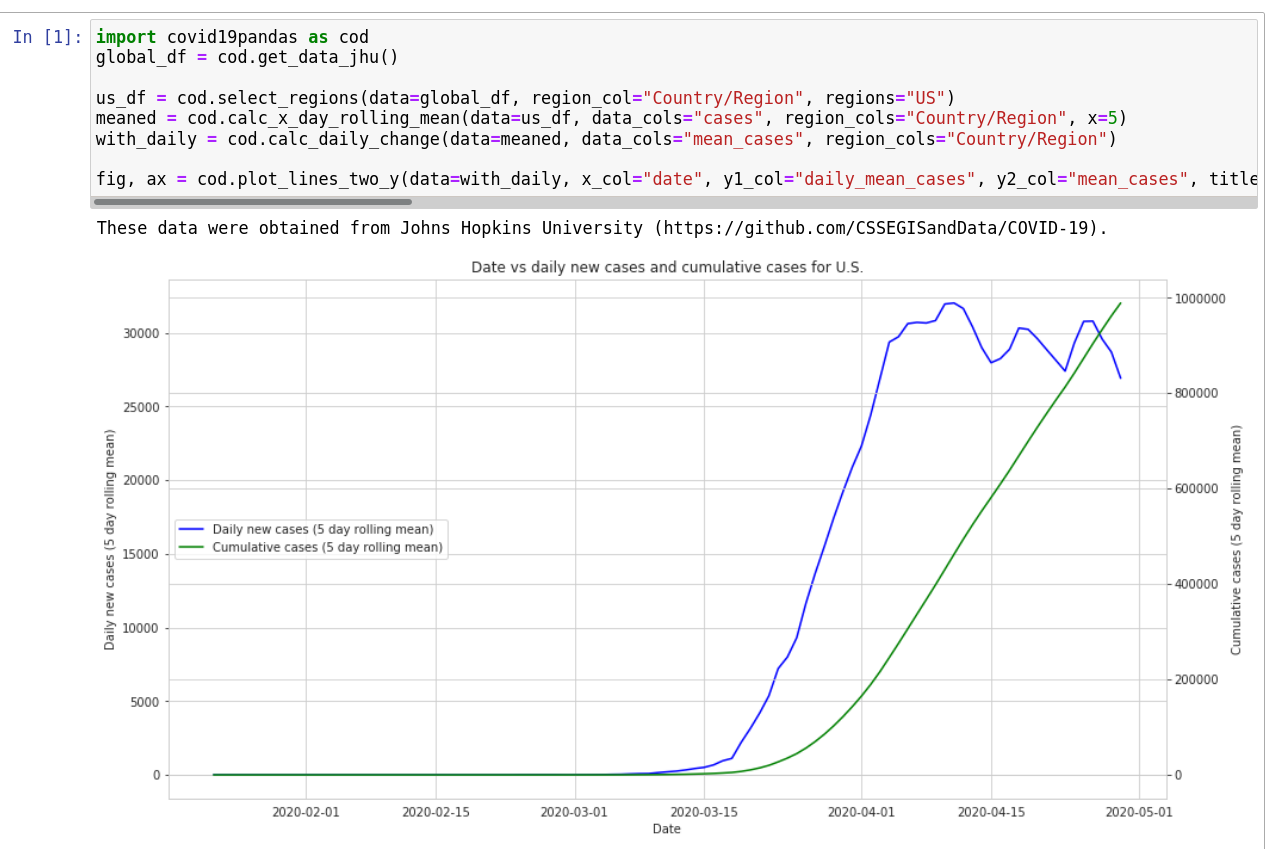
Our tutorials show you how to create plots like the one below. Using our built-in functions, you can create many plot types in just two to five function calls.
Related Skills
node-connect
349.7kDiagnose OpenClaw node connection and pairing failures for Android, iOS, and macOS companion apps
frontend-design
109.7kCreate distinctive, production-grade frontend interfaces with high design quality. Use this skill when the user asks to build web components, pages, or applications. Generates creative, polished code that avoids generic AI aesthetics.
openai-whisper-api
349.7kTranscribe audio via OpenAI Audio Transcriptions API (Whisper).
qqbot-media
349.7kQQBot 富媒体收发能力。使用 <qqmedia> 标签,系统根据文件扩展名自动识别类型(图片/语音/视频/文件)。
