Gencore
Generate duplex/single consensus reads to reduce sequencing noises and remove duplications
Install / Use
/learn @OpenGene/GencoreREADME

gencore
An efficient tool to remove sequencing duplications and eliminate sequencing errors by generating consensus reads.
- What's gencore
- Download, compile and install
- Why to use gencore
- Understand the output
- How it works
- Command examples
- UMI format
- All options
- Read/cite gencore paper
what's gencore?
gencore is a tool for fast and powerful deduplication for paired-end next-generation sequencing (NGS) data. It is much faster and uses much less memory than Picard and other tools. It generates very informative reports in both HTML and JSON formats. It's based on an algorithm for generating consensus reads, and that's why it's named gencore.
Basically, gencore groups the reads derived from the same original DNA template, merges them by generating a consensus read, which contains much less errors than the original reads.
gencore supports the data with unique molecular identifiers (UMI). If your FASTQ data has UMI integrated, you can use fastp to shift the UMI to read query names, and use gencore to generate consensus reads.
This tool can eliminate the errors introduced by library preparation and sequencing processes, and consenquently reduce the false positives for downstream variant calling. This tool can also be used to remove duplicated reads. Since it generates consensus reads from duplicated reads, it outputs much cleaner data than conventional duplication remover. Due to these advantages, it is especially useful for processing ultra-deep sequencing data for cancer samples.
gencore accepts a sorted BAM/SAM with its corresponding reference fasta as input, and outputs an unsorted BAM/SAM.
take a quick glance of the informative report
- Sample HTML report: http://opengene.org/gencore/gencore.html
- Sample JSON report: http://opengene.org/gencore/gencore.json
try gencore to generate above reports
- BAM file for testing: http://opengene.org/gencore/input.sorted.bam
- BED file for testing: http://opengene.org/gencore/test.bed
- Reference genome file: ftp://ftp.ncbi.nlm.nih.gov/sra/reports/Assembly/GRCh37-HG19_Broad_variant/Homo_sapiens_assembly19.fasta
- Command for testing:
gencore -i input.sorted.bam -o output.bam -r Homo_sapiens_assembly19.fasta -b test.bed --coverage_sampling=50000
- After the processing is finished, check the
gencore.htmlandgencore.jsonin the working directory. The option--coverage_sampling=50000is to change the default setting(coverage_sampling=10000)to generate smaller report files by reducing the coverage sampling rate.
quick examples
The simplest way
gencore -i input.sorted.bam -o output.bam -r hg19.fasta
With a BED file to specify the capturing regions
gencore -i input.sorted.bam -o output.bam -r hg19.fasta -b test.bed
Only output the fragment with >=2 supporting reads (useful for aggressive denoising)
gencore -i input.sorted.bam -o output.bam -r hg19.fasta -b test.bed -s 2
get gencore
install with Bioconda
conda install -c bioconda gencore
download binary
This binary is only for Linux systems: http://opengene.org/gencore/gencore
# this binary was compiled on CentOS, and tested on CentOS/Ubuntu
wget http://opengene.org/gencore/gencore
chmod a+x ./gencore
or compile from source
# step 1: download and compile htslib from: https://github.com/samtools/htslib
# step 2: get gencore source (you can also use browser to download from master or releases)
git clone https://github.com/OpenGene/gencore.git

# step 3: build
cd gencore
make

# step 4: install
sudo make install
why to use gencore?
As described above, gencore can eliminate the errors introduced by library preparation and sequencing processes, and consenquently it can greatly reduce the false positives for downstream variant calling. Let me show your an example.
original BAM
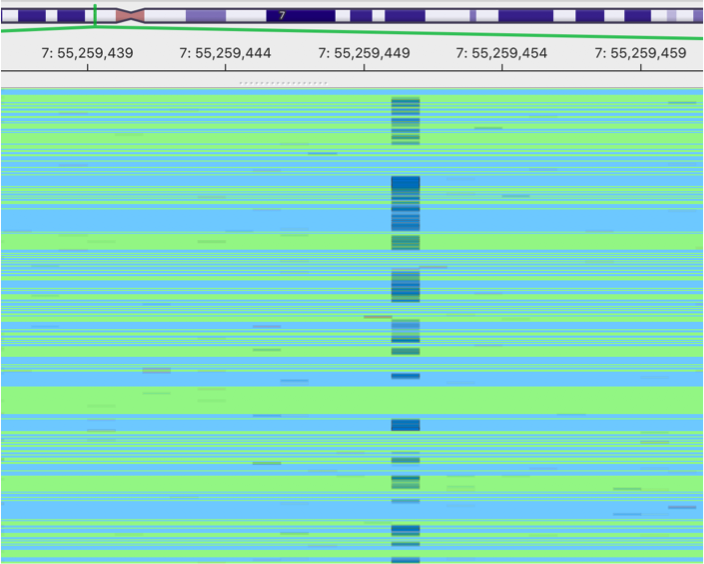
This is an image showing a pileup of the original BAM. A lot of sequencing errors can be observed.
gencore processed BAM

This is the image showing the result of gencore processed BAM. It becomes much cleaner. Cheers!
QC result reported by gencore
gencore also performs some quality control when processing deduplication and generating consensus reads. Basically it reports mapping rate, duplication rate, mismatch rate and some statisticical results. Especially, gencore reports the coverate statistics of input BAM file in genome scale, and in capturing regions (if a BED file is specified).
gencore reports the results both in HTML format and JSON format for manually checking and downstream analysis. See the examples of interactive HTML report and JSON reports.
coverate statistics in genome scale

coverate statistics in capturing regions

understand the output
gencore outputs following files:
- the processed BAM. In this BAM, each consensus read will have a tag
FR, which meansforward read number of this consensus read. If the read is a duplex consensus read, it will also has a tagRR, which meansreverse read number of this consensus read. Downstream tools can read theFRandRRtags for further processing or variant calling. In following example, the first read is a single-stranded consensus sequence (only has aFRtag), and the second read is a duplex consensus sequence (has bothFRandRRtags):
A00250:28:H2HC3DSX2:1:1117:3242:5321:UMI_GCT_CTA        161     chr12   25377992        60      143M    =       25378431        582
     GCAATAATTTTTGTCAGAAAAATGCATTAAATGAATAACAGAATTTCTGTTGGCTTTCTGGGTATTGTCTTTCTTTAATGAGACCTTTCTCCAGAAATAAACACATCCTCAAAAAAATTCTGCCAAAGTAAAATTCTTCAAAT FFFFFFFFFFFFFFFFFFF,FFFFFFFFFFFFFFFFFFFFFFFFFFFFFFFFFFFFFFFFFFFFFFFFFFFFFFFFFFFFFFFFFFFFFFFFFFFFFFFFFFFFFFFFFFFFFFFFFFFFFFFFFFFFFFFFFFFFFFFFFFF NM:i:1  MD:Z:34G108     AS:i:138        XS:i:21 RG:Z:cfdna      FR:i:2
A00250:28:H2HC3DSX2:1:2316:10547:25989:UMI_AAC_AGA      161     chr12   25377993        60      143M    =       25378462        612
     CAATAATTTTTGTCAGAAAAATGCATTAAATGAATAACAGAATTTCTGTTGGCTTTCTGGGTATTGTCTTTCTTTAATGAGACCTTTCTCCAGAAATAAACACATCCTCAAAAAAATTCTGCCAAAGTAAAATTCTTCAAATA FFFFF:FFFFFFFFFFFFFFFFFFFFF:FF:FFFFFFFFFF,FFFFFFFFFFFF,:FFFFFFFFFFFFFFFFFFFF:FFFFFFFFFFFFFFFFFFF:FFF,!FF:F:F:F,FFF,F:FFFF,,:F,FFFF:FF:,:FF:F,:, NM:i:1  MD:Z:33G67A41   AS:i:133        XS:i:21 RG:Z:cfdna      FR:i:1  RR:i:5
- the JSON report. A json file contains lots of statistical informations.
- the HTML report. A html file visualizes the information of the JSON.
- the plain text output.
how it works
important steps:
- clusters the reads by their mapping positions and UMIs (if UMIs are applicable).
- for each cluster, compares its supporting reads number (the number of reads/pairs for this DNA fragment) with the threshold specified by
supporting_reads. If it passes, start to generate a consensus read for it. - if the reads are paired, finds the overlapped region of each pair, and scores the bases in the overlapped regions according their concordance and base quality.
- for each base position at this cluster, computes the total scores of each different nucleotide (A/T/C/G/N).
- if there exists a major nucleotide with good quality, use this nucleotide for this position; otherwise, check the reference nucleotide from reference genome (if reference is specified).
- when checking the reference, if there exists one or more reads are concordant with reference genome with high quality, or all reads at this positions are with low quality, use the reference nucleotide for this position.
the quality thresholds
gencore uses 3 different thresholds, and they can be specified by the commandline options:
| Quality threshold | Default Score | CMD option | |- | - | - | | High Quality | 30 (Q30) | --high_qual | | Moderate Quality | 20 (Q20) | --moderate_qual | | Low Quality | 15 (Q15) | --low_qual |
the scoring
gencore assigns a score to each base in a read of a read cluster, the score means the confidence of this base. The score is given by following rules:
| in overlapped region? | matched with its pair? | condition? | score for this base | | - | - | - | - | | NO | N/A | HIGH_QUAL <= this_qual | 8 | | NO | N/A | MODERATE_QUAL <= this_qual < HIGH_QUAL | 6 | | NO | N/A | LOW_QUAL <= this_qual < MODERATE_QUAL | 4 | | NO | N/A | this_qual < LOW_QUAL | 2 | | YES | YES | 2 * HIGH_QUAL <= this_qual + pair_qual | 12 | | YES | YES | 2 * MODERATE_QUAL <= this_qual + pair_qual < 2 * HIGH_QUAL | 10 | | YES | YES | 2 * LOW_QUAL <= this_qual + pair_qual < 2 * MODERATE_QUAL | 8 | | YES | YES | this_qual + pair_qual < 2 * LOW_QUAL | 6 | | YES | NO | HIGH_QUAL <= this_qual - pair_qual | 5 | | YES | NO | MODERATE_QUAL <= this_qual - pair_qual < HIGH_QUAL | 3 | | YES | NO | LOW_QUAL <= this_qual - pair_qual < MODERATE_QUAL | 1 | | YES | NO | this_qual - pair_qual < LOW_QUAL | 0 |
In this table:
this_qualis the quality of this basepair_qualis the quality of the corresponding in the overlapped region of a pair.HIGH_QUALis the quality threshold that can be specified by--high_qualMODERATE_QUALis th
Related Skills
node-connect
340.2kDiagnose OpenClaw node connection and pairing failures for Android, iOS, and macOS companion apps
frontend-design
84.1kCreate distinctive, production-grade frontend interfaces with high design quality. Use this skill when the user asks to build web components, pages, or applications. Generates creative, polished code that avoids generic AI aesthetics.
openai-whisper-api
340.2kTranscribe audio via OpenAI Audio Transcriptions API (Whisper).
commit-push-pr
84.1kCommit, push, and open a PR
