Dx
Python support package for DEX visualization
Install / Use
/learn @MSeal/DxREADME
dx
<p align="center"> This package provides convenient formatting and IPython display formatter registration for tabular data and DEX media types. </p> <p align="center"> <a href="https://github.com/noteable-io/dx/actions/workflows/ci.yaml"> <img src="https://github.com/noteable-io/dx/actions/workflows/ci.yaml/badge.svg" alt="CI" /> </a> <a href="https://codecov.io/gh/noteable-io/dx" > <img src="https://codecov.io/gh/noteable-io/dx/branch/main/graph/badge.svg?token=XGXSTD3GSI" alt="codecov code coverage"/> </a> <img alt="PyPI - License" src="https://img.shields.io/pypi/l/dx" /> <img alt="PyPI - Python Version" src="https://img.shields.io/pypi/pyversions/dx" /> <img alt="PyPI" src="https://img.shields.io/pypi/v/dx"> <a href="https://github.com/psf/black"><img alt="Code style: black" src="https://img.shields.io/badge/code%20style-black-000000.svg"></a> </p>A Pythonic Data Explorer, open sourced with ❤️ by <a href="https://noteable.io">Noteable</a>, a collaborative notebook platform that enables teams to use and visualize data, together.
Requirements
Python 3.8+
Installation
Poetry
poetry add dx
Then import the package:
import dx
Pip
pip install dx
Then import the package:
import dx
Usage
The dx library currently enables DEX media type visualization of pandas DataFrame and Series objects, as well as numpy ndarray objects. This can be handled in two ways:
- explicit
dx.display()calls - setting the
display_modeto update the IPython display formatter for a session
With dx.display()
dx.display() will display a single dataset using the DEX media type. It currently supports:
-
pandas
DataFrameobjectsimport pandas as pd import random df = pd.DataFrame({ 'random_ints': [random.randint(0, 100) for _ in range(500)], 'random_floats': [random.random() for _ in range(500)], }) dx.display(df)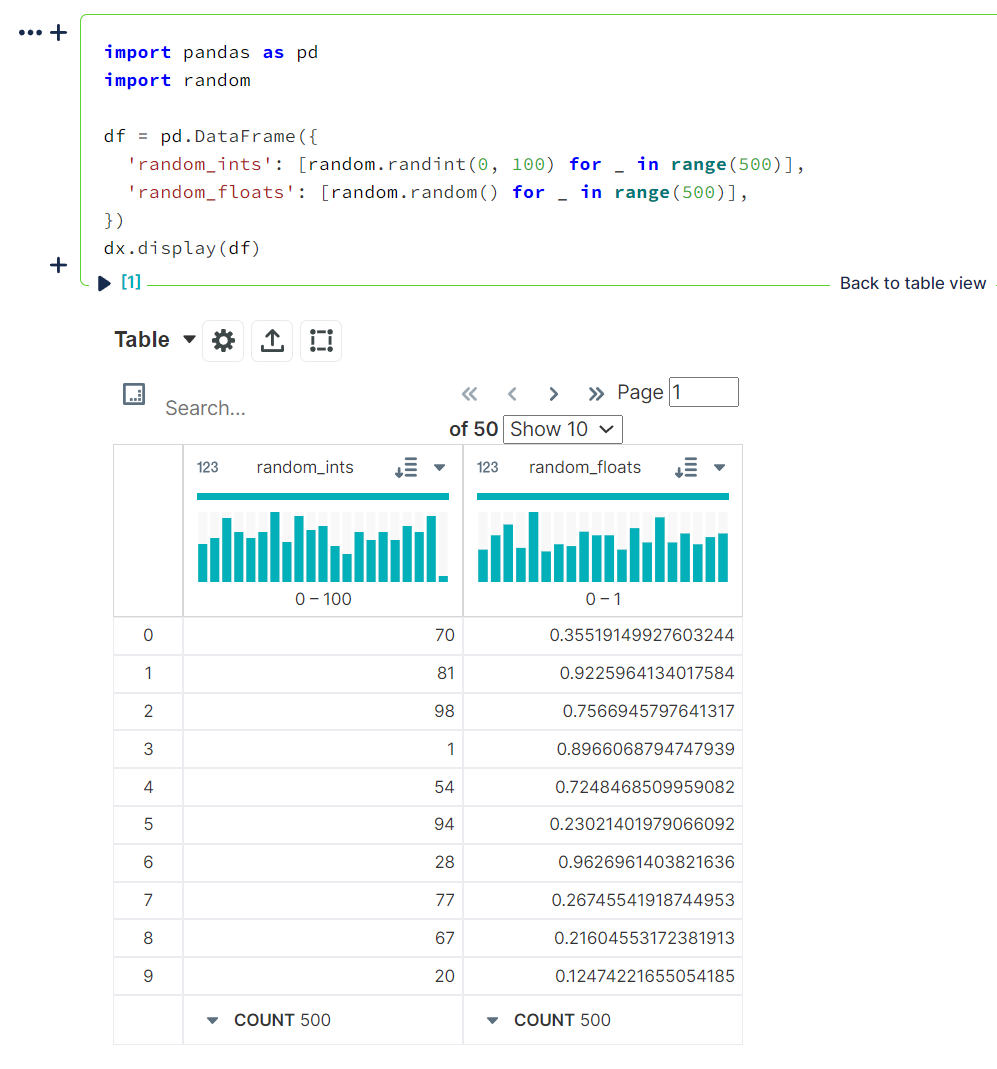
-
tabular data as
dictorlisttypesdx.display([ [1, 5, 10, 20, 500], [1, 2, 3, 4, 5], [0, 0, 0, 0, 1] ])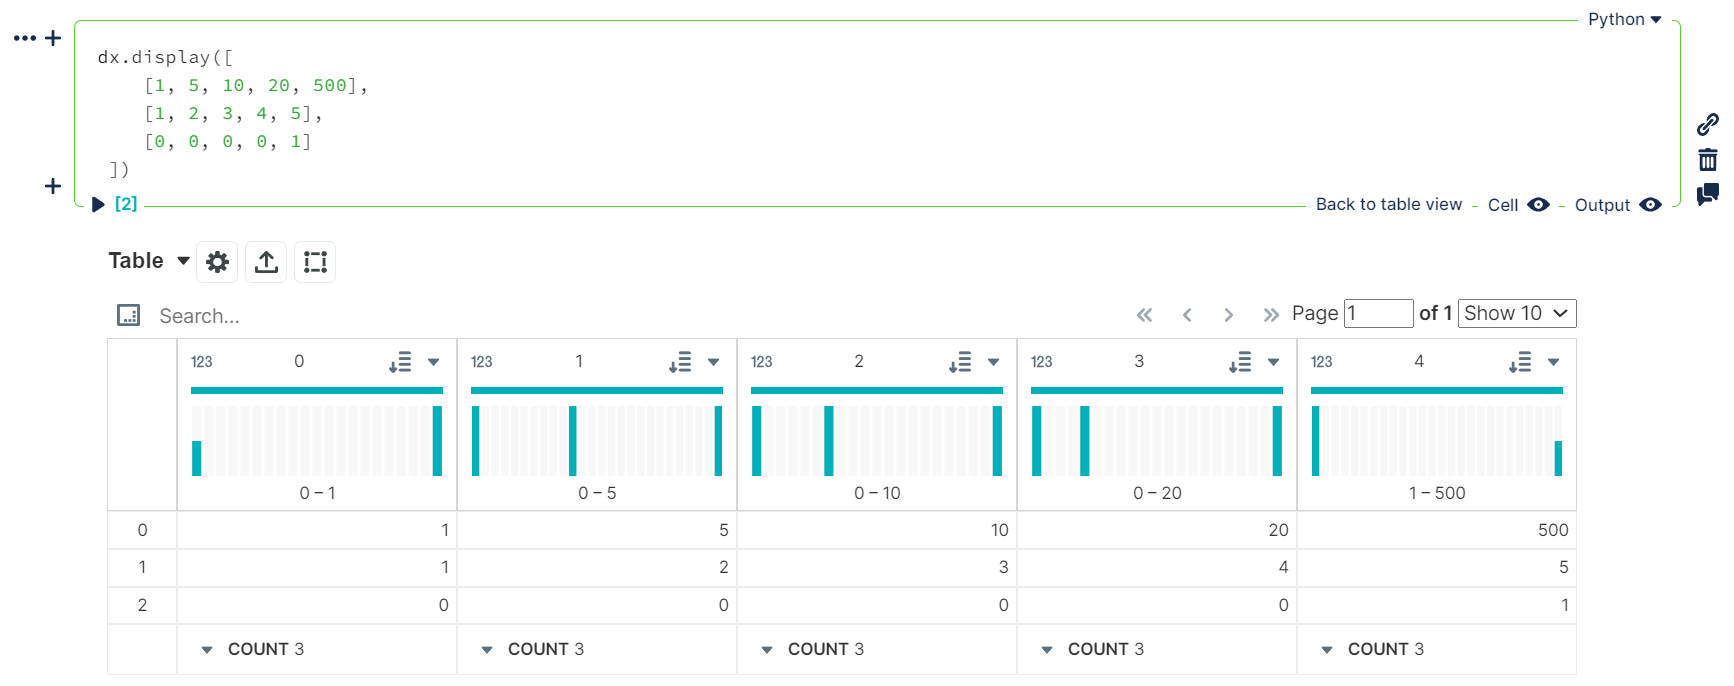
-
.csvor.jsonfilepathsdf = dx.random_dataframe() df.to_csv("dx_docs_sample.csv", index=False) dx.display("dx_docs_sample.csv")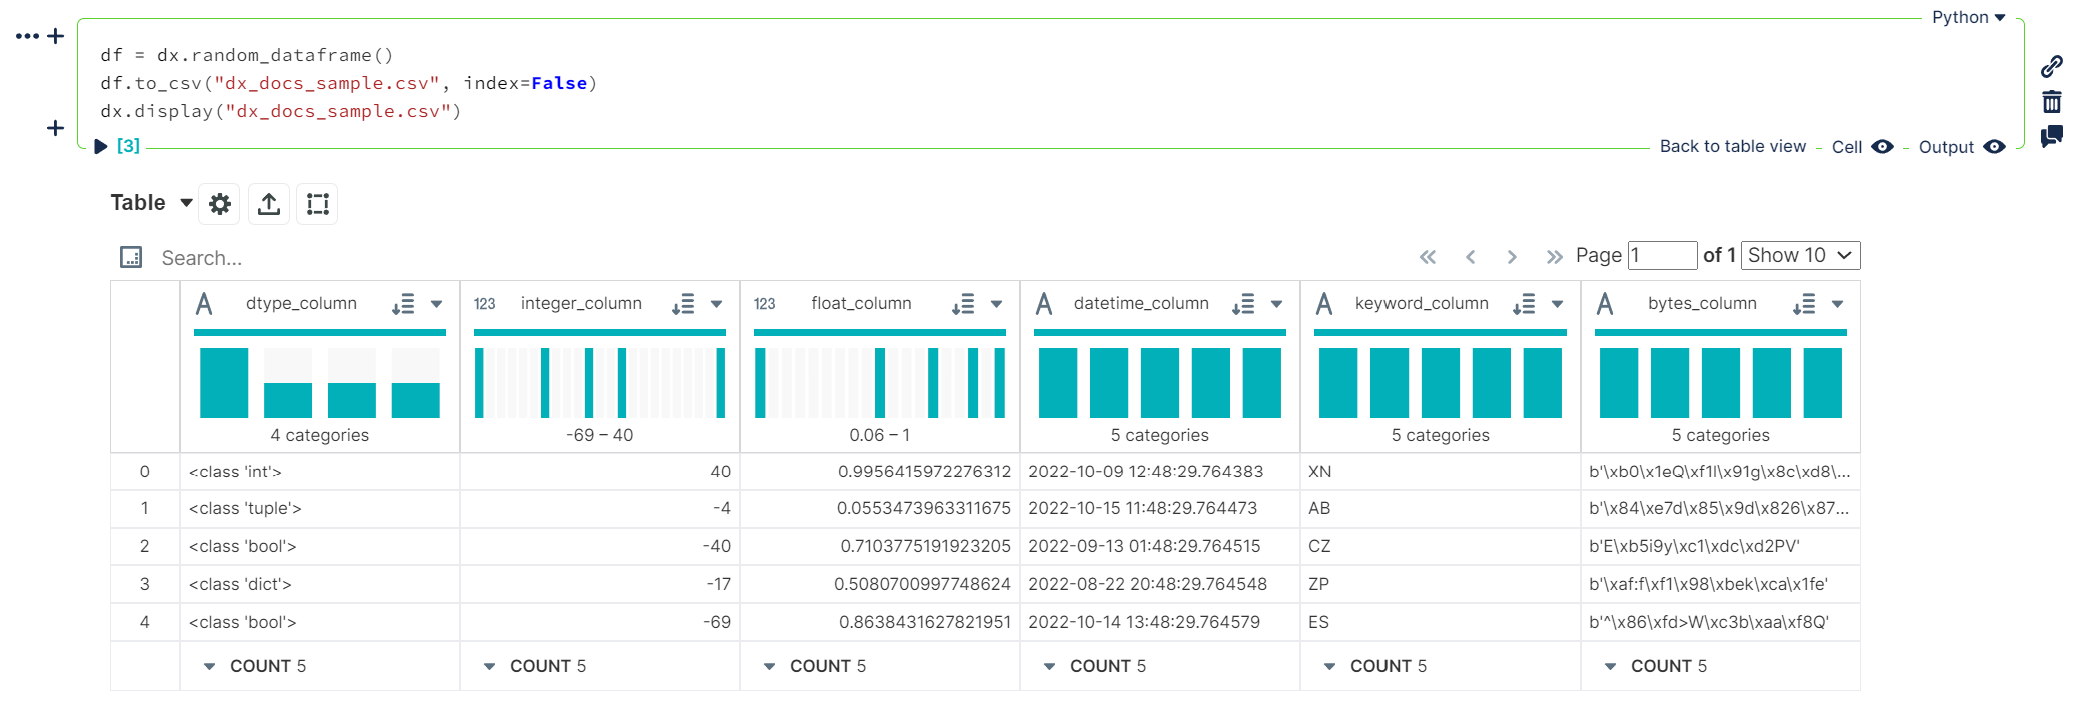
With dx.set_display_mode()
Using either "simple" or "enhanced" display modes will allow dx will update the current IPython display formatters to allow DEX media type visualization of pandas DataFrame objects for an entire notebook / kernel session instead of the default DataFrame display output.
This will adjust pandas options to:
- increasing the number of rows displayed to
50000from pandas default of60 - increasing the number of columns displayed to
50from pandas default of20 - enabling
html.table_schema(Falseby default in pandas)
This will also handle some basic column cleaning and generate a schema for the DataFrame using pandas.io.json.build_table_schema. Depending on the display mode, the data will be transformed into either a list of dictionaries or list of lists of columnar values.
"simple"- list of dictionaries"enhanced"- list of lists
NOTE: Unlike
dx.display(), this only affects pandas DataFrames (or any types set insettings.RENDERABLE_TYPES); it does not affect the display of.csv/.jsonfile data, ordict/listoutputs
-
dx.set_display_mode("simple")import dx import numpy as np import pandas as pd # enable DEX display outputs from now on dx.set_display_mode("simple") df = pd.read_csv("dx_docs_sample.csv") dfdf2 = pd.DataFrame( [ [1, 5, 10, 20, 500], [1, 2, 3, np.nan, 5], [0, 0, 0, np.nan, 1] ], columns=['a', 'b', 'c', 'd', 'e'] ) df2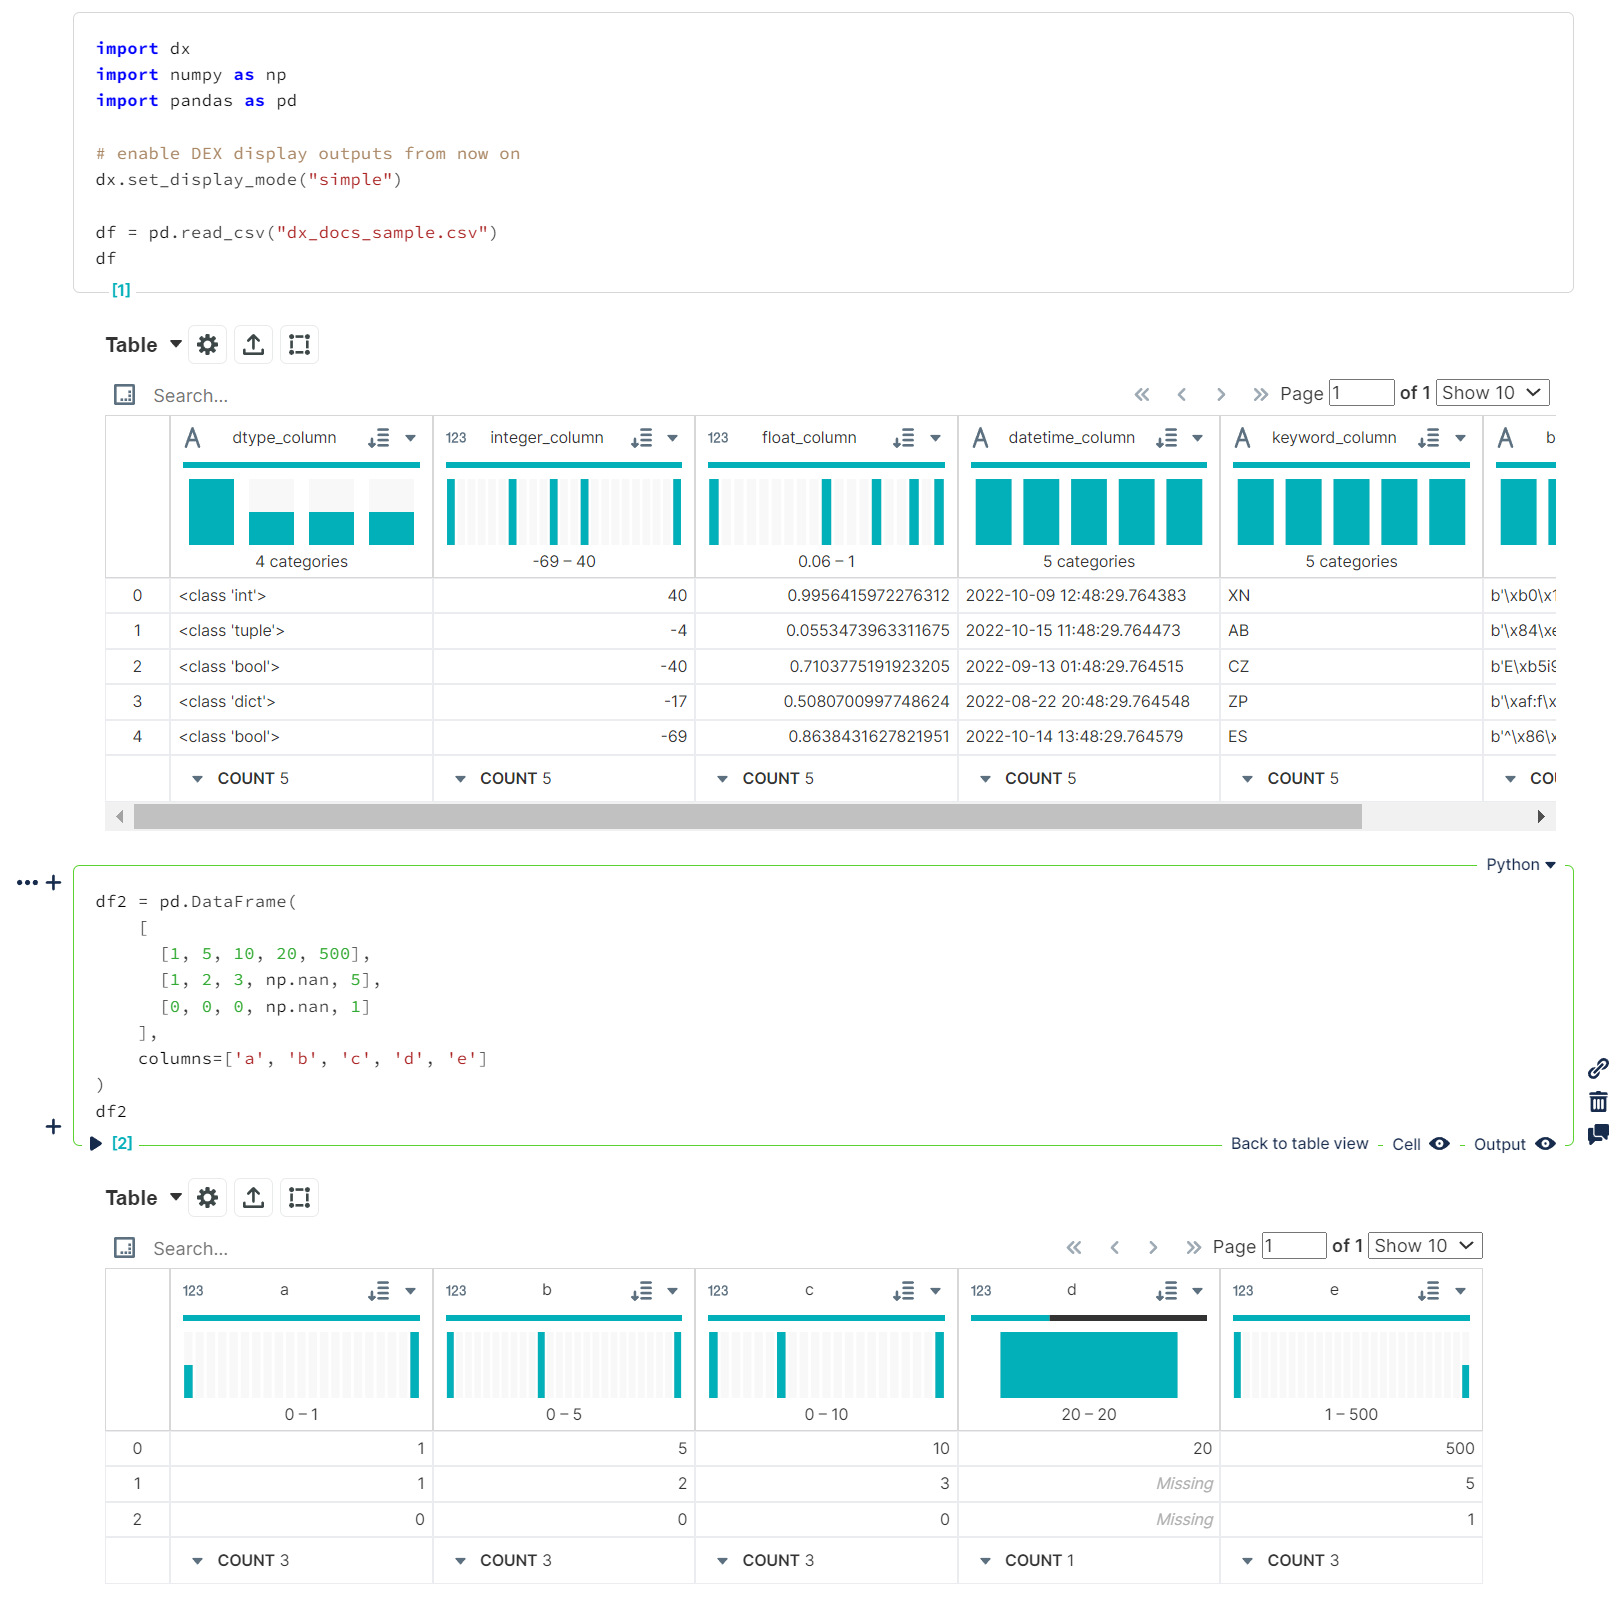
If, at any point, you want to go back to the default display formatting (vanilla pandas output), use the "plain" display mode. This will revert the IPython display format update to its original state and put the pandas options back to their default values.
dx.set_display_mode("plain")# revert to original pandas display outputs from now on dx.set_display_mode("plain") df = pd.read_csv("dx_docs_sample.csv") dfdf2 = pd.DataFrame( [ [1, 5, 10, 20, 500], [1, 2, 3, np.nan, 5], [0, 0, 0, np.nan, 1] ], columns=['a', 'b', 'c', 'd', 'e'] ) df2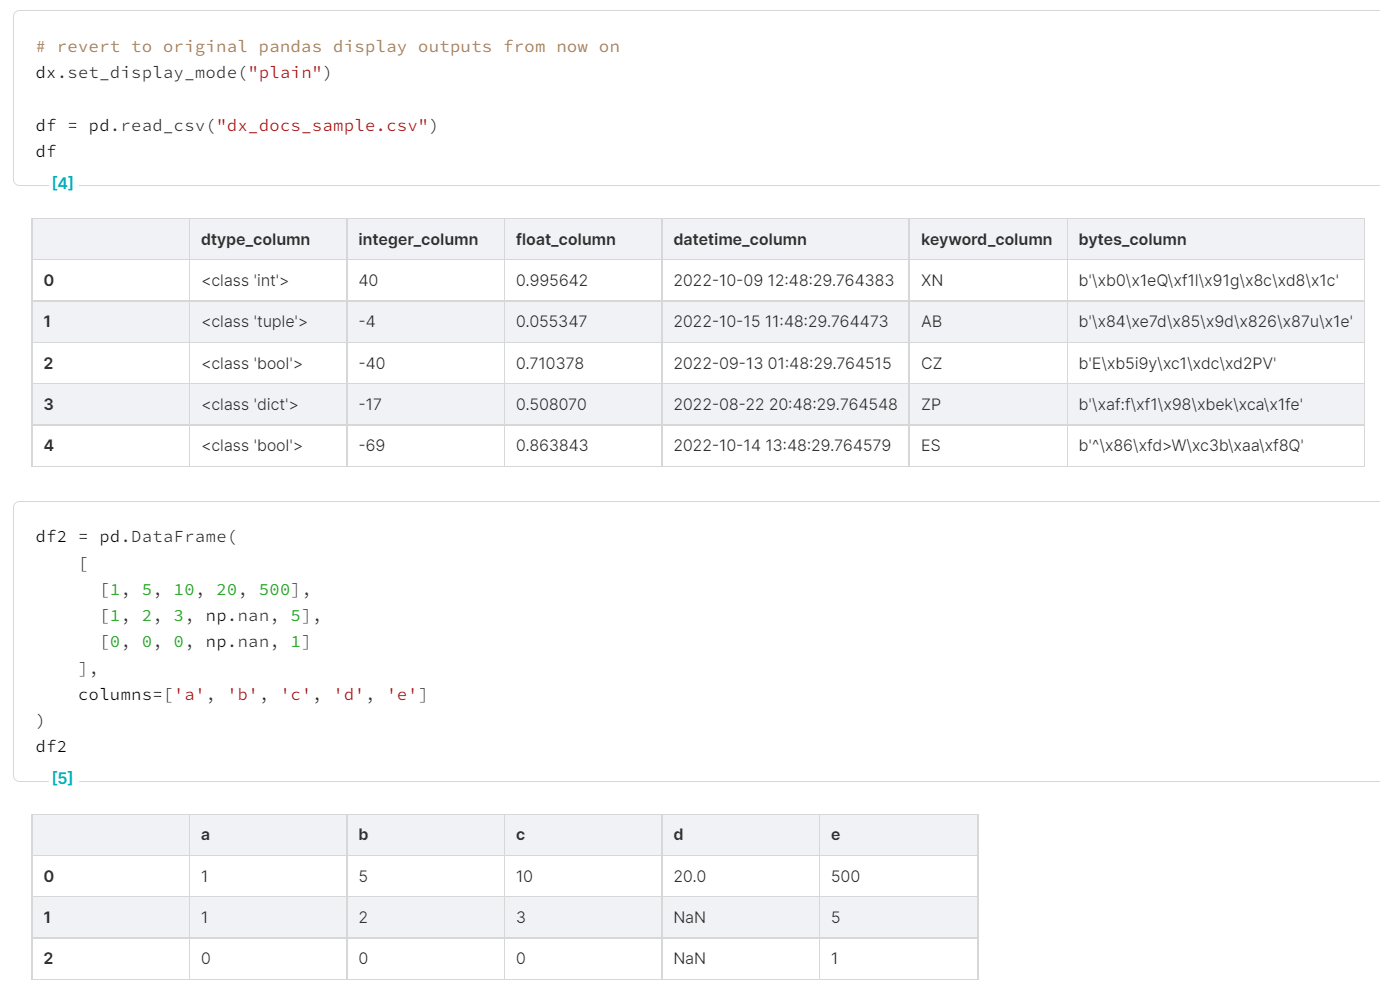
Custom Settings
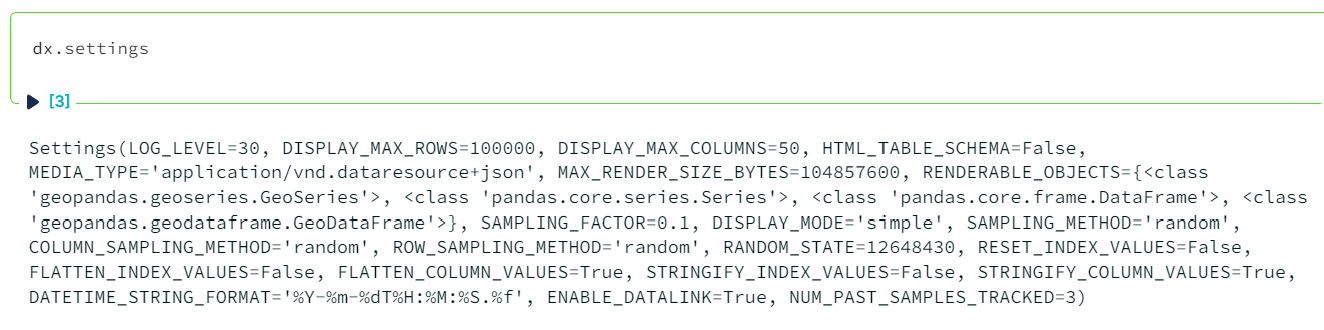
Default settings for dx can be found by calling dx.settings:
Each can be set using dx.set_option():
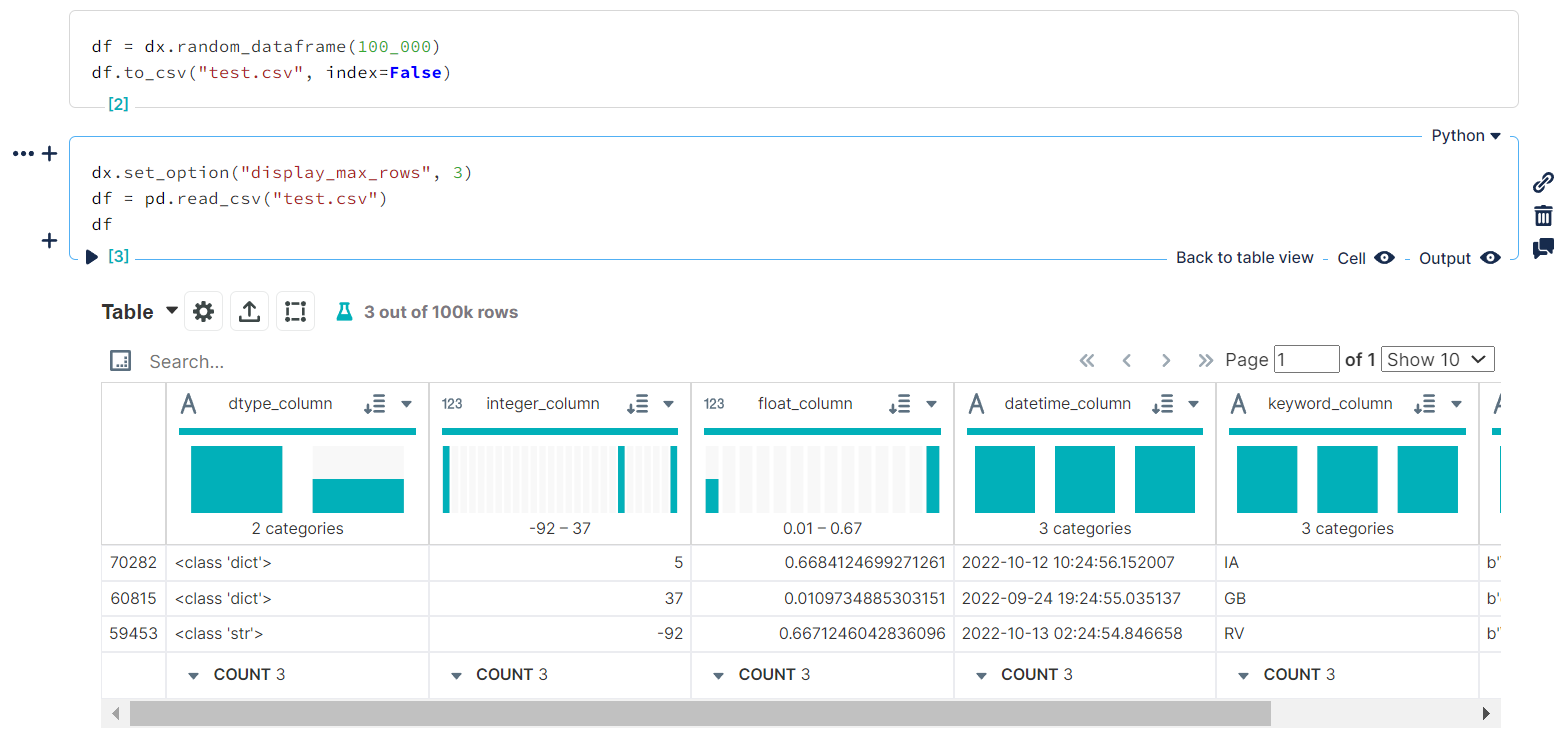 Setting
 DISPLAY_MAX_ROWS to 3 for the current session
...or with the dx.settings_context() context manager:
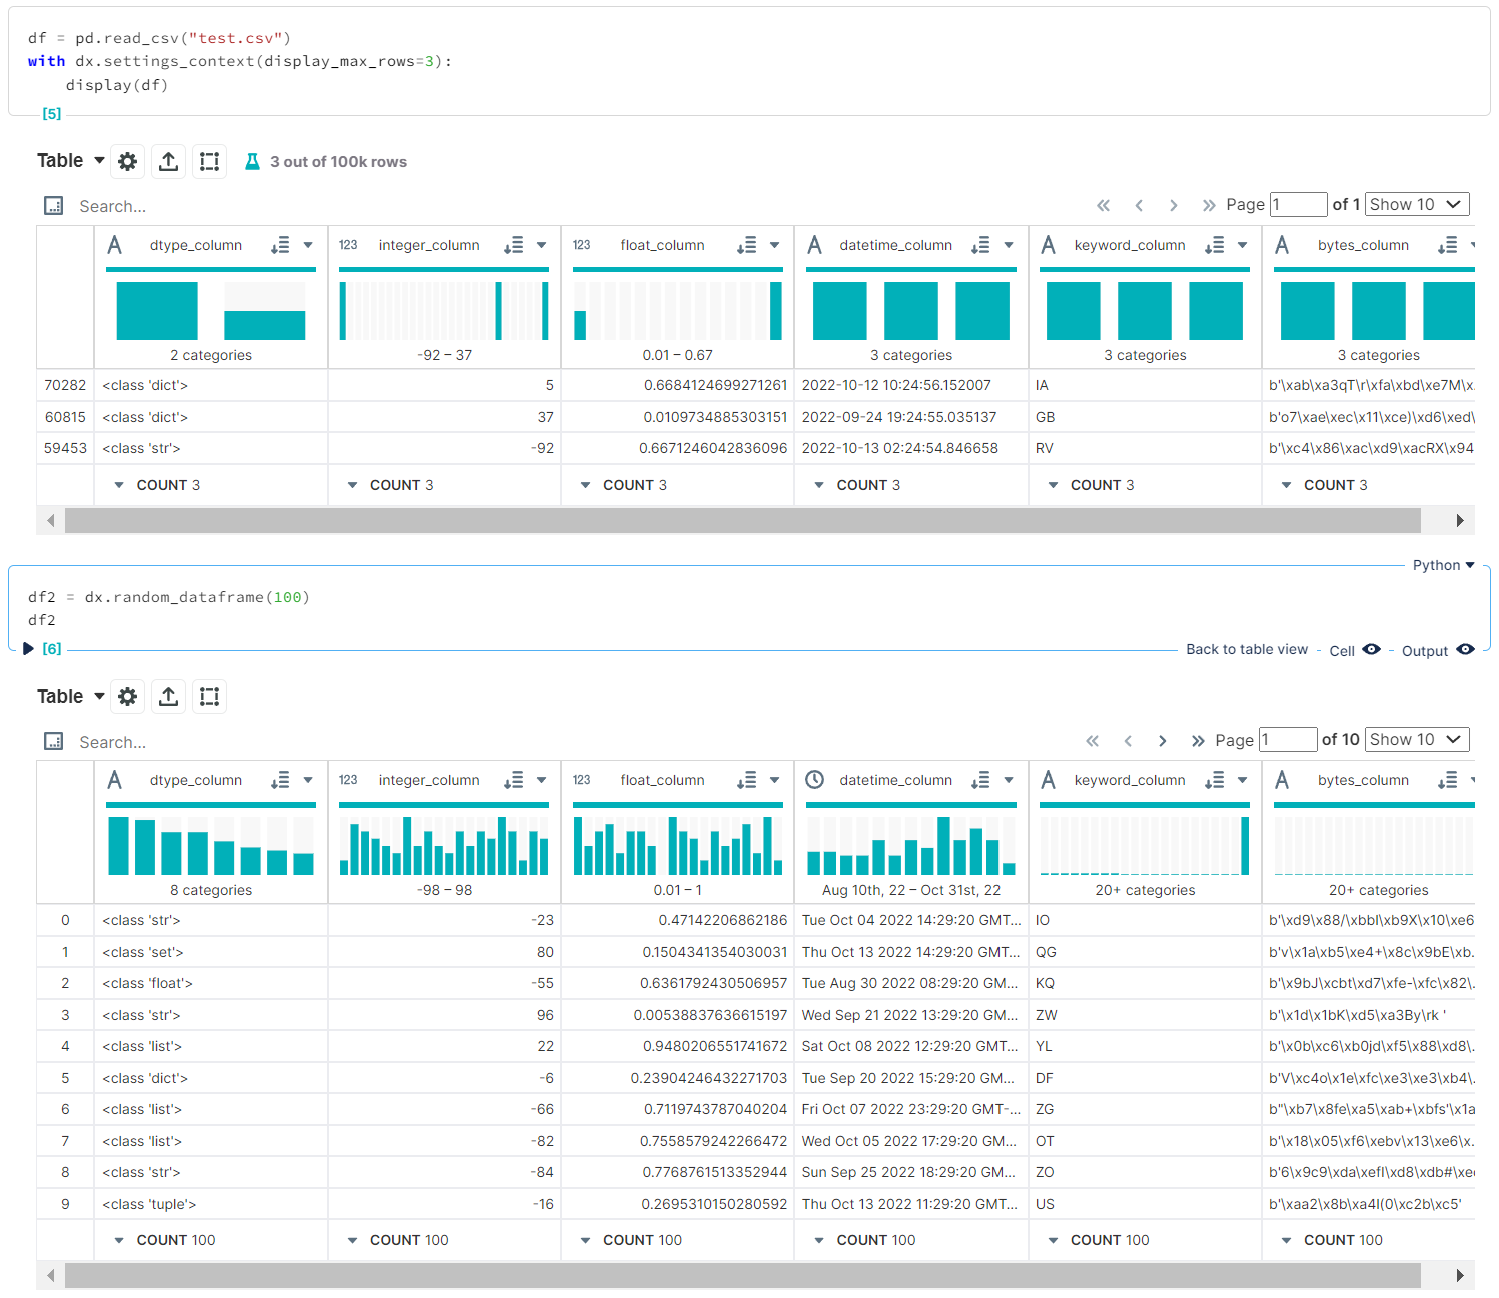 Setting
 DISPLAY_MAX_ROWS to 3 within the current context, leaving options for the rest of the session alone
Generating Sample Data
Documentation coming soon!
Usage Outside of Noteable
If using this package in a notebook environment outside of Noteable, the frontend should support the following media types:
application/vnd.dataresource+jsonfor"simple"display modeapplication/vnd.dex.v1+jsonfor"enhanced"display mode
Contributing
See CONTRIBUTING.md.
Code of Conduct
We follow the noteable.io code of conduct.
LICENSE
See LICENSE.md.
<p align="center">Open sourced with ❤️ by <a href="https://noteable.io">Noteable</a> for the community.</p> <img href="https://pages.noteable.io/private-beta-access" src="https://assets.noteable.io/github/2022-07-29/noteable.png" alt="Boost Data Collaboration with Notebooks">
Related Skills
claude-opus-4-5-migration
83.1kMigrate prompts and code from Claude Sonnet 4.0, Sonnet 4.5, or Opus 4.1 to Opus 4.5
model-usage
337.1kUse CodexBar CLI local cost usage to summarize per-model usage for Codex or Claude, including the current (most recent) model or a full model breakdown. Trigger when asked for model-level usage/cost data from codexbar, or when you need a scriptable per-model summary from codexbar cost JSON.
openhue
337.1kControl Philips Hue lights and scenes via the OpenHue CLI.
sag
337.1kElevenLabs text-to-speech with mac-style say UX.
