Wdb
An improbable web debugger through WebSockets
Install / Use
/learn @Kozea/WdbREADME
wdb - Web Debugger

![]()
Description
wdb is a full featured web debugger based on a client-server architecture.
The wdb server which is responsible of managing debugging instances along with browser connections (through websockets) is based on Tornado. The wdb clients allow step by step debugging, in-program python code execution, code edition (based on CodeMirror) setting breakpoints...
Due to this architecture, all of this is fully compatible with multithread and multiprocess programs.
wdb works with python 2 (2.6, 2.7), python 3 (3.2, 3.3, 3.4, 3.5) and pypy. Even better, it is possible to debug a python 2 program with a wdb server running on python 3 and vice-versa or debug a program running on a computer with a debugging server running on another computer inside a web page on a third computer!
Even betterer, it is now possible to pause a currently running python process/thread using code injection from the web interface. (This requires gdb and ptrace enabled)
In other words it's a very enhanced version of pdb directly in your browser with nice features.
Installation:
Global installation:
$ pip install wdb.server
In virtualenv or with a different python installation:
$ pip install wdb
(You must have the server installed and running)
Quick test
To try wdb, first you have to start the wdb server:
$ wdb.server.py &
Optionally, you can automatically activate daemons with systemd (socket activation):
    $ cd /etc/systemd/system
    # curl -O https://raw.githubusercontent.com/Kozea/wdb/master/server/wdb.server.service
    # curl -O https://raw.githubusercontent.com/Kozea/wdb/master/server/wdb.server.socket
    # systemctl enable wdb.server.socket
    # systemctl start wdb.server.socket
Next run:
$ python -m wdb your_file.py
Wdb will open a debugging window right in your browser, paused at the beginning of your program.
You can access to http://localhost:1984/ to have an overview of the server.
NB: You have to start the server only once. Multiple Debugging sessions can be run simultaneously without problem.
This is not the only way to debug a program, see below.
Usage
Setting trace
To debug any program, with the server on, just add:
    import wdb
    wdb.set_trace()
anywhere in your code. Your program will stop at the set_trace line. (Just like pdb)
Tracing code
To inspect your code on exception, you can do the following:
    from wdb import trace
    with trace():
        wrong_code()
Any exception during wrong_code will launch a debugging session.
You can also use the start_trace() and stop_trace methods.
(It's better to put the stop_trace in a finally block to avoid tracing all your program after an exception.)
Debugging web servers
wdb provides some tools to make it work nicely with different webservers:
Wsgi servers
For wsgi servers you can use the WdbMiddleware:
    from wdb.ext import WdbMiddleware
    wsgi_app = Whathever_wsgi_server_lib()
    my_app = WdbMiddleware(wsgi_app)
    my_app.serve_forever()
Flask
or using Flask:
    from flask import Flask
    from wdb.ext import WdbMiddleware
    app = Flask(__name__)
    app.debug = True
    app.wsgi_app = WdbMiddleware(app.wsgi_app)
    app.run(use_debugger=False) # Disable builtin Werkzeug debugger
you can also use the Flask-Wdb extension
    from flask import Flask
    from flask_wdb import Wdb

    app = Flask(__name__)
    app.debug = True
    Wdb(app)

    app.run()
Django
or using django:
Add the middleware in your wsgi.py:
After:
    from django.core.wsgi import get_wsgi_application
    application = get_wsgi_application()
Add this:
    from wdb.ext import WdbMiddleware
    application = WdbMiddleware(application)
And in your settings.py, activate exception propagation:
    DEBUG = True
    DEBUG_PROPAGATE_EXCEPTIONS = True
CherryPy
or using CherryPy:
import cherrypy
from wdb.ext import WdbMiddleware

class HelloWorld(object):
    @cherrypy.expose
    def index(self):
        undefined_method() # This will fail
        return "Hello World!"

cherrypy.config.update({'global':{'request.throw_errors': True}})
app = cherrypy.Application(HelloWorld())
app.wsgiapp.pipeline.append(('debugger', WdbMiddleware))

cherrypy.quickstart(app)
Tornado
In tornado, which is not a wsgi server, you can use the wdb_tornado function which will monkey patch the execute method on RequestHandlers:
    from wdb.ext import wdb_tornado
    from tornado.web import Application
    my_app = Application([(r"/", MainHandler)])
    if options.debug:
        wdb_tornado(my_app)
    my_app.listen(8888)
Page loading time become slow
If wdb slows down too much of your application (tracing all the things takes time), you can start it disabled with:
    my_app = WdbMiddleware(wsgi_app, start_disabled=True)  # or
    wdb_tornado(my_app, start_disabled=True)
Then when you get an exception just click on the on/off button.
Remote debugging
You can easily do remote debugging with wdb:
Let's say you want to run a program p.py on computer A and you want to debug it on computer B.
Start wdb server on computer A and launch this:
WDB_NO_BROWSER_AUTO_OPEN=True python -m wdb p.py
And open a browser on computer B at the url given by wdb log.
Now you can also run wdb server on a computer C and run on computer A:
WDB_NO_BROWSER_AUTO_OPEN=True WDB_SOCKET_SERVER=computerC.addr WDB_SOCKET_PORT=19840 python -m wdb p.py
And go with computer B to http://computerC/debug/session/[uuid in log] there you can step into p.py running in computer A. Yay !
You can use different configurations:
See wdb.server.py --help for changing ports on server and these environnement vars for wdb instances:
WDB_SOCKET_SERVER         # WDB server host
WDB_SOCKET_PORT           # WDB server socket port
WDB_WEB_SERVER            # WDB server host for browser openning
WDB_WEB_PORT              # WDB server http port
WDB_NO_BROWSER_AUTO_OPEN  # To disable the automagic browser openning (which can't be done if the browser is not on the same machine)
Docker
If you are developing locally with Docker, you can also use wdb to debug a code running inside a container. The basic setup looks like this:
- Start
wdb.server.pyrunning in a container and expose port1984to your host computer, this will server the debugging web server. - Start debugging in your app container, making sure to set
WDB_SOCKET_SERVERto the address of the server container, and point it to the expoed port19840on that server. - When a trace is reached, open up
http://<your-docker-hostname>:1984
I will walk through this process in detail, using Docker Compose to set up the containers.
Let's say your docker-compose.yml looks like
their example for using with Django:
db:
  image: postgres
web:
  build: .
  command: python manage.py runserver 0.0.0.0:8000
  volumes:
    - .:/code
  ports:
    - "8000:8000"
  links:
    - db
Next lets add the wdb server part now and tell the web to link to it:
db:
  image: postgres
web:
  build: .
  command: python manage.py runserver 0.0.0.0:8000
  volumes:
    - .:/code
  ports:
    - "8000:8000"
  links:
    - db
    - wdb
  environment:
    WDB_SOCKET_SERVER: wdb
    WDB_NO_BROWSER_AUTO_OPEN: True
wdb:
  image: kozea/wdb
  ports:
    - "1984:1984"
And add wdb to your requirements.txt in your web app:
$ echo 'wdb' >> requirements.txt
Now we can use wdb.set_trace() in our python app.
# ... some code
import wdb
wdb.set_trace()
Then you have to rebuild your web application and start everything up again
$ docker-compose stop
$ docker-compose build web
$ docker-compose up
Now you can access http://<local docker server>:1984, to
see the traces as they come up in your app.
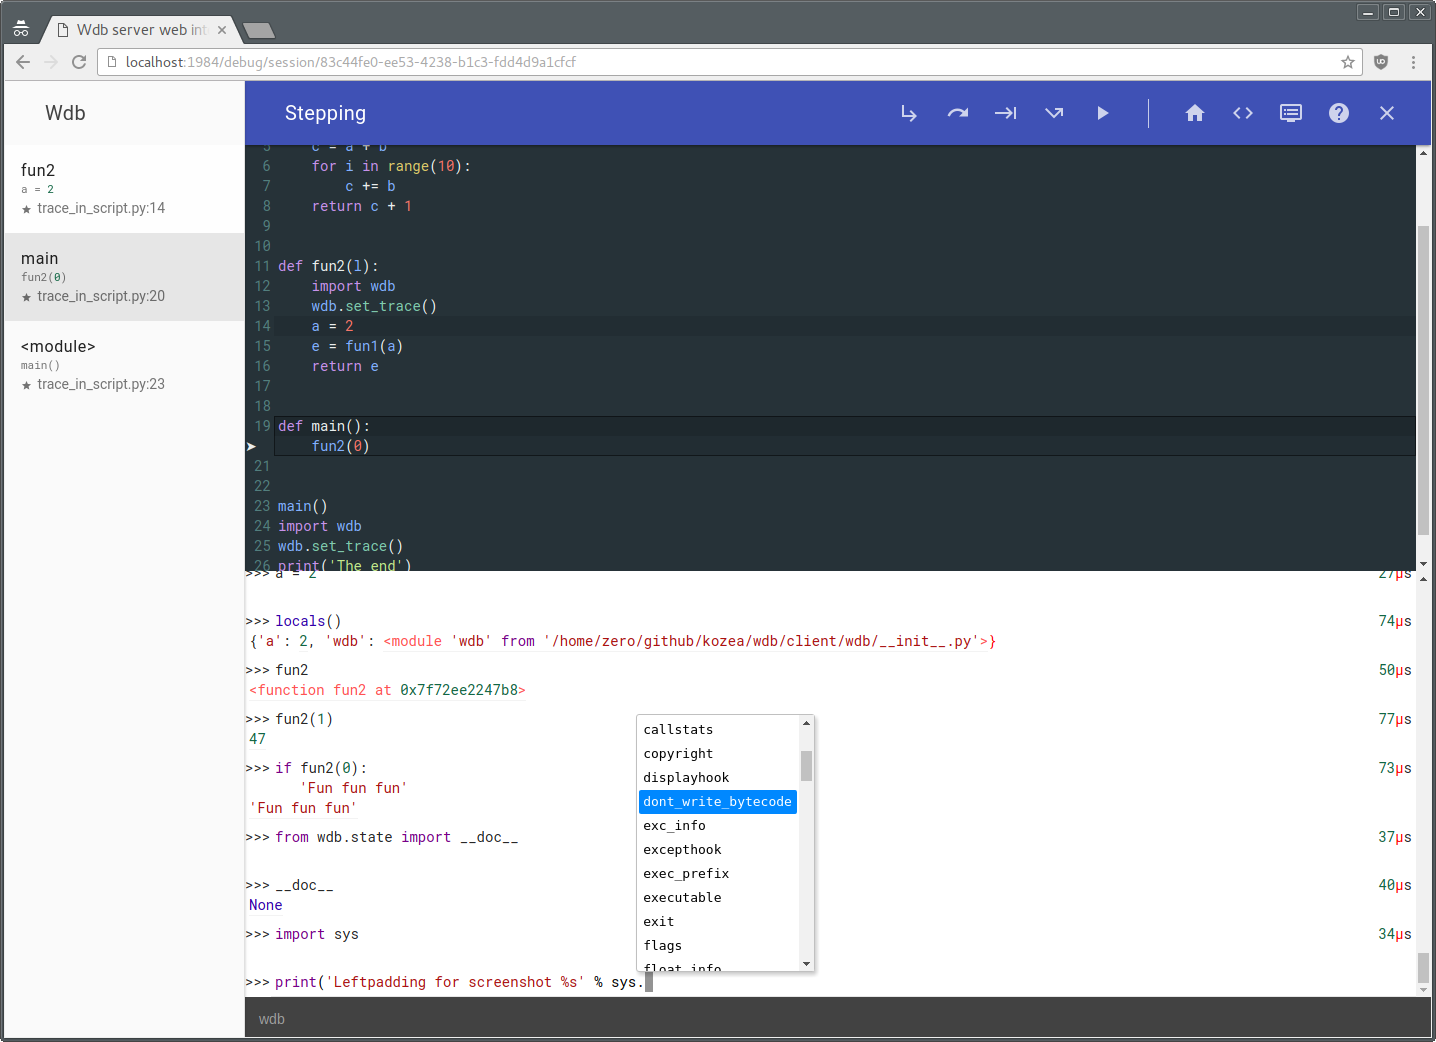
In browser usage
Once you are in a breakpoint or in an exception, you can eval all you want in the prompt under the code.
Multi-lines are partially supported using [Shift] + [Enter].
There is now help available by clicking on the top help button.
As of now the following special commands are supported during breakpoint:
* .s or [Ctrl] + [↓] or [F11]    : Step into
* .n or [Ctrl] + [→] or [F10]    : Step over (Next)
* .r or [Ctrl] + [↑] or [F9]     : Step out (Return)
* .c or [Ctrl] + [←] or [F8]     : Continue
* .u or [F7]                     : Until (Next over loops)
* .j lineno                      : Jump to lineno (Must be at bottom frame and in the same function)
* .b arg                         : Set a session breakpoint, see below for what arg can be*
* .t arg                         : Set a temporary breakpoint, arg follow the same syntax as .b
* .z arg                         : Delete existing breakpoint
* .l                             : List active breakpoints
* .f                             : Echo all typed commands in the current debugging session
* .d expression                  : Dump the result of expression in a table
* .w expression                  : Watch expression in current file (Click on the name to remove)
* .q
Related Skills
node-connect
343.1kDiagnose OpenClaw node connection and pairing failures for Android, iOS, and macOS companion apps
frontend-design
90.0kCreate distinctive, production-grade frontend interfaces with high design quality. Use this skill when the user asks to build web components, pages, or applications. Generates creative, polished code that avoids generic AI aesthetics.
openai-whisper-api
343.1kTranscribe audio via OpenAI Audio Transcriptions API (Whisper).
qqbot-media
343.1kQQBot 富媒体收发能力。使用 <qqmedia> 标签,系统根据文件扩展名自动识别类型(图片/语音/视频/文件)。
