
Pygwalker
PyGWalker: Turn your dataframe into an interactive UI for visual analysis
Install / Use
npx skills add Kanaries/pygwalkerInstalls into whichever agent you are using.
README
English | Español | Français | Deutsch | 中文 | Türkçe | 日本語 | 한국어 | Русский
<p align="center"><a href="https://github.com/Kanaries/pygwalker"><img width=100% alt="" src="https://github.com/user-attachments/assets/f90db669-6e5a-45d3-942e-547c9d0471c9" /></a></p> <h2 align="center">PyGWalker: A Python Library for Exploratory Data Analysis with Visualization</h2> <p align="center"> <a href="https://arxiv.org/abs/2406.11637"> <img src="https://img.shields.io/badge/arXiv-2406.11637-b31b1b.svg" height="18" align="center"> </a> <a href="https://badge.fury.io/py/pygwalker"> <img src="https://badge.fury.io/py/pygwalker.svg" alt="PyPI version" height="18" align="center" /> </a> <a href="https://mybinder.org/v2/gh/Kanaries/pygwalker/main"> <img src="https://mybinder.org/badge_logo.svg" alt="binder" height="18" align="center" /> </a> <a href="https://pypi.org/project/pygwalker"> <img src="https://img.shields.io/pypi/dm/pygwalker" alt="PyPI downloads" height="18" align="center" /> </a> <a href="https://anaconda.org/conda-forge/pygwalker"> <img src="https://anaconda.org/conda-forge/pygwalker/badges/version.svg" alt="conda-forge" height="18" align="center" /> </a> </p> <p align="center"> <a href="https://discord.gg/Z4ngFWXz2U"> <img alt="discord invitation link" src="https://dcbadge.vercel.app/api/server/Z4ngFWXz2U?style=flat" align="center" /> </a> <a href='https://twitter.com/intent/follow?original_referer=https%3A%2F%2Fpublish.twitter.com%2F&ref_src=twsrc%5Etfw&screen_name=kanaries_data&tw_p=followbutton'> <img alt="Twitter Follow" src="https://img.shields.io/twitter/follow/kanaries_data?style=social" alt='Twitter' align="center" /> </a> <a href="https://kanaries-community.slack.com/join/shared_invite/zt-20kpp56wl-ke9S0MxTcNQjUhKf6SOfvQ#/shared-invite/email"> <img src="https://img.shields.io/badge/Slack-green?style=flat-square&logo=slack&logoColor=white" alt="Join Kanaries on Slack" align="center" /> </a> </p>[!NOTE] The English README is the source of truth for the API reference, installation, and development instructions. Translated READMEs are community-maintained and may lag behind this file.
PyGWalker can simplify your Jupyter Notebook data analysis and data visualization workflow, by turning your pandas dataframe into an interactive user interface for visual exploration.
PyGWalker (pronounced like "Pig Walker", just for fun) is named as an abbreviation of "Python binding of Graphic Walker". It integrates Jupyter Notebook with Graphic Walker, an open-source alternative to Tableau. It allows data scientists to visualize / clean / annotates the data with simple drag-and-drop operations and even natural language queries.
https://github.com/Kanaries/pygwalker/assets/22167673/2b940e11-cf8b-4cde-b7f6-190fb10ee44b
[!TIP] If you want more AI features, we also build runcell, an AI Code Agent in Jupyter that understands your code/data/cells and generate code, execute cells and take actions for you. It can be used in jupyter lab with
pip install runcell
https://github.com/user-attachments/assets/9ec64252-864d-4bd1-8755-83f9b0396d38
Visit Google Colab, Kaggle Code or Graphic Walker Online Demo to test it out!
If you prefer using R, check GWalkR, the R wrapper of Graphic Walker. If you prefer a Desktop App that can be used offline and without any coding, check out PyGWalker Desktop.
Features
PyGWalker is a Python library that simplifies data analysis and visualization workflows by turning pandas, polars, and pyarrow table data into interactive visual interfaces. It offers a variety of features that make it a powerful tool for data exploration:
-
Interactive Data Exploration:
- Drag-and-drop interface for easy visualization creation.
- Real-time updates as you make changes to the visualization.
- Ability to zoom, pan, and filter the data.
-
Data Cleaning and Transformation:
- Visual data cleaning tools to identify and remove outliers or inconsistencies.
- Ability to create new variables and features based on existing data.
-
Advanced Visualization Capabilities:
- Support for various chart types (bar charts, line charts, scatter plots, etc.).
- Customization options for colors, labels, and other visual elements.
- Interactive features like tooltips and drill-down capabilities.
-
Integration with Jupyter Notebooks:
- Seamless integration with Jupyter Notebooks for a smooth workflow.
-
Open-Source and Free:
- Available for free and allows for customization and extension.
Getting Started
Check our video tutorial about using pygwalker, pygwalker + streamlit and pygwalker + snowflake, How to explore data with PyGWalker in Python
| Run in Kaggle | Run in Colab |
|--------------------------------------------------------------|--------------------------------------------------------|
| 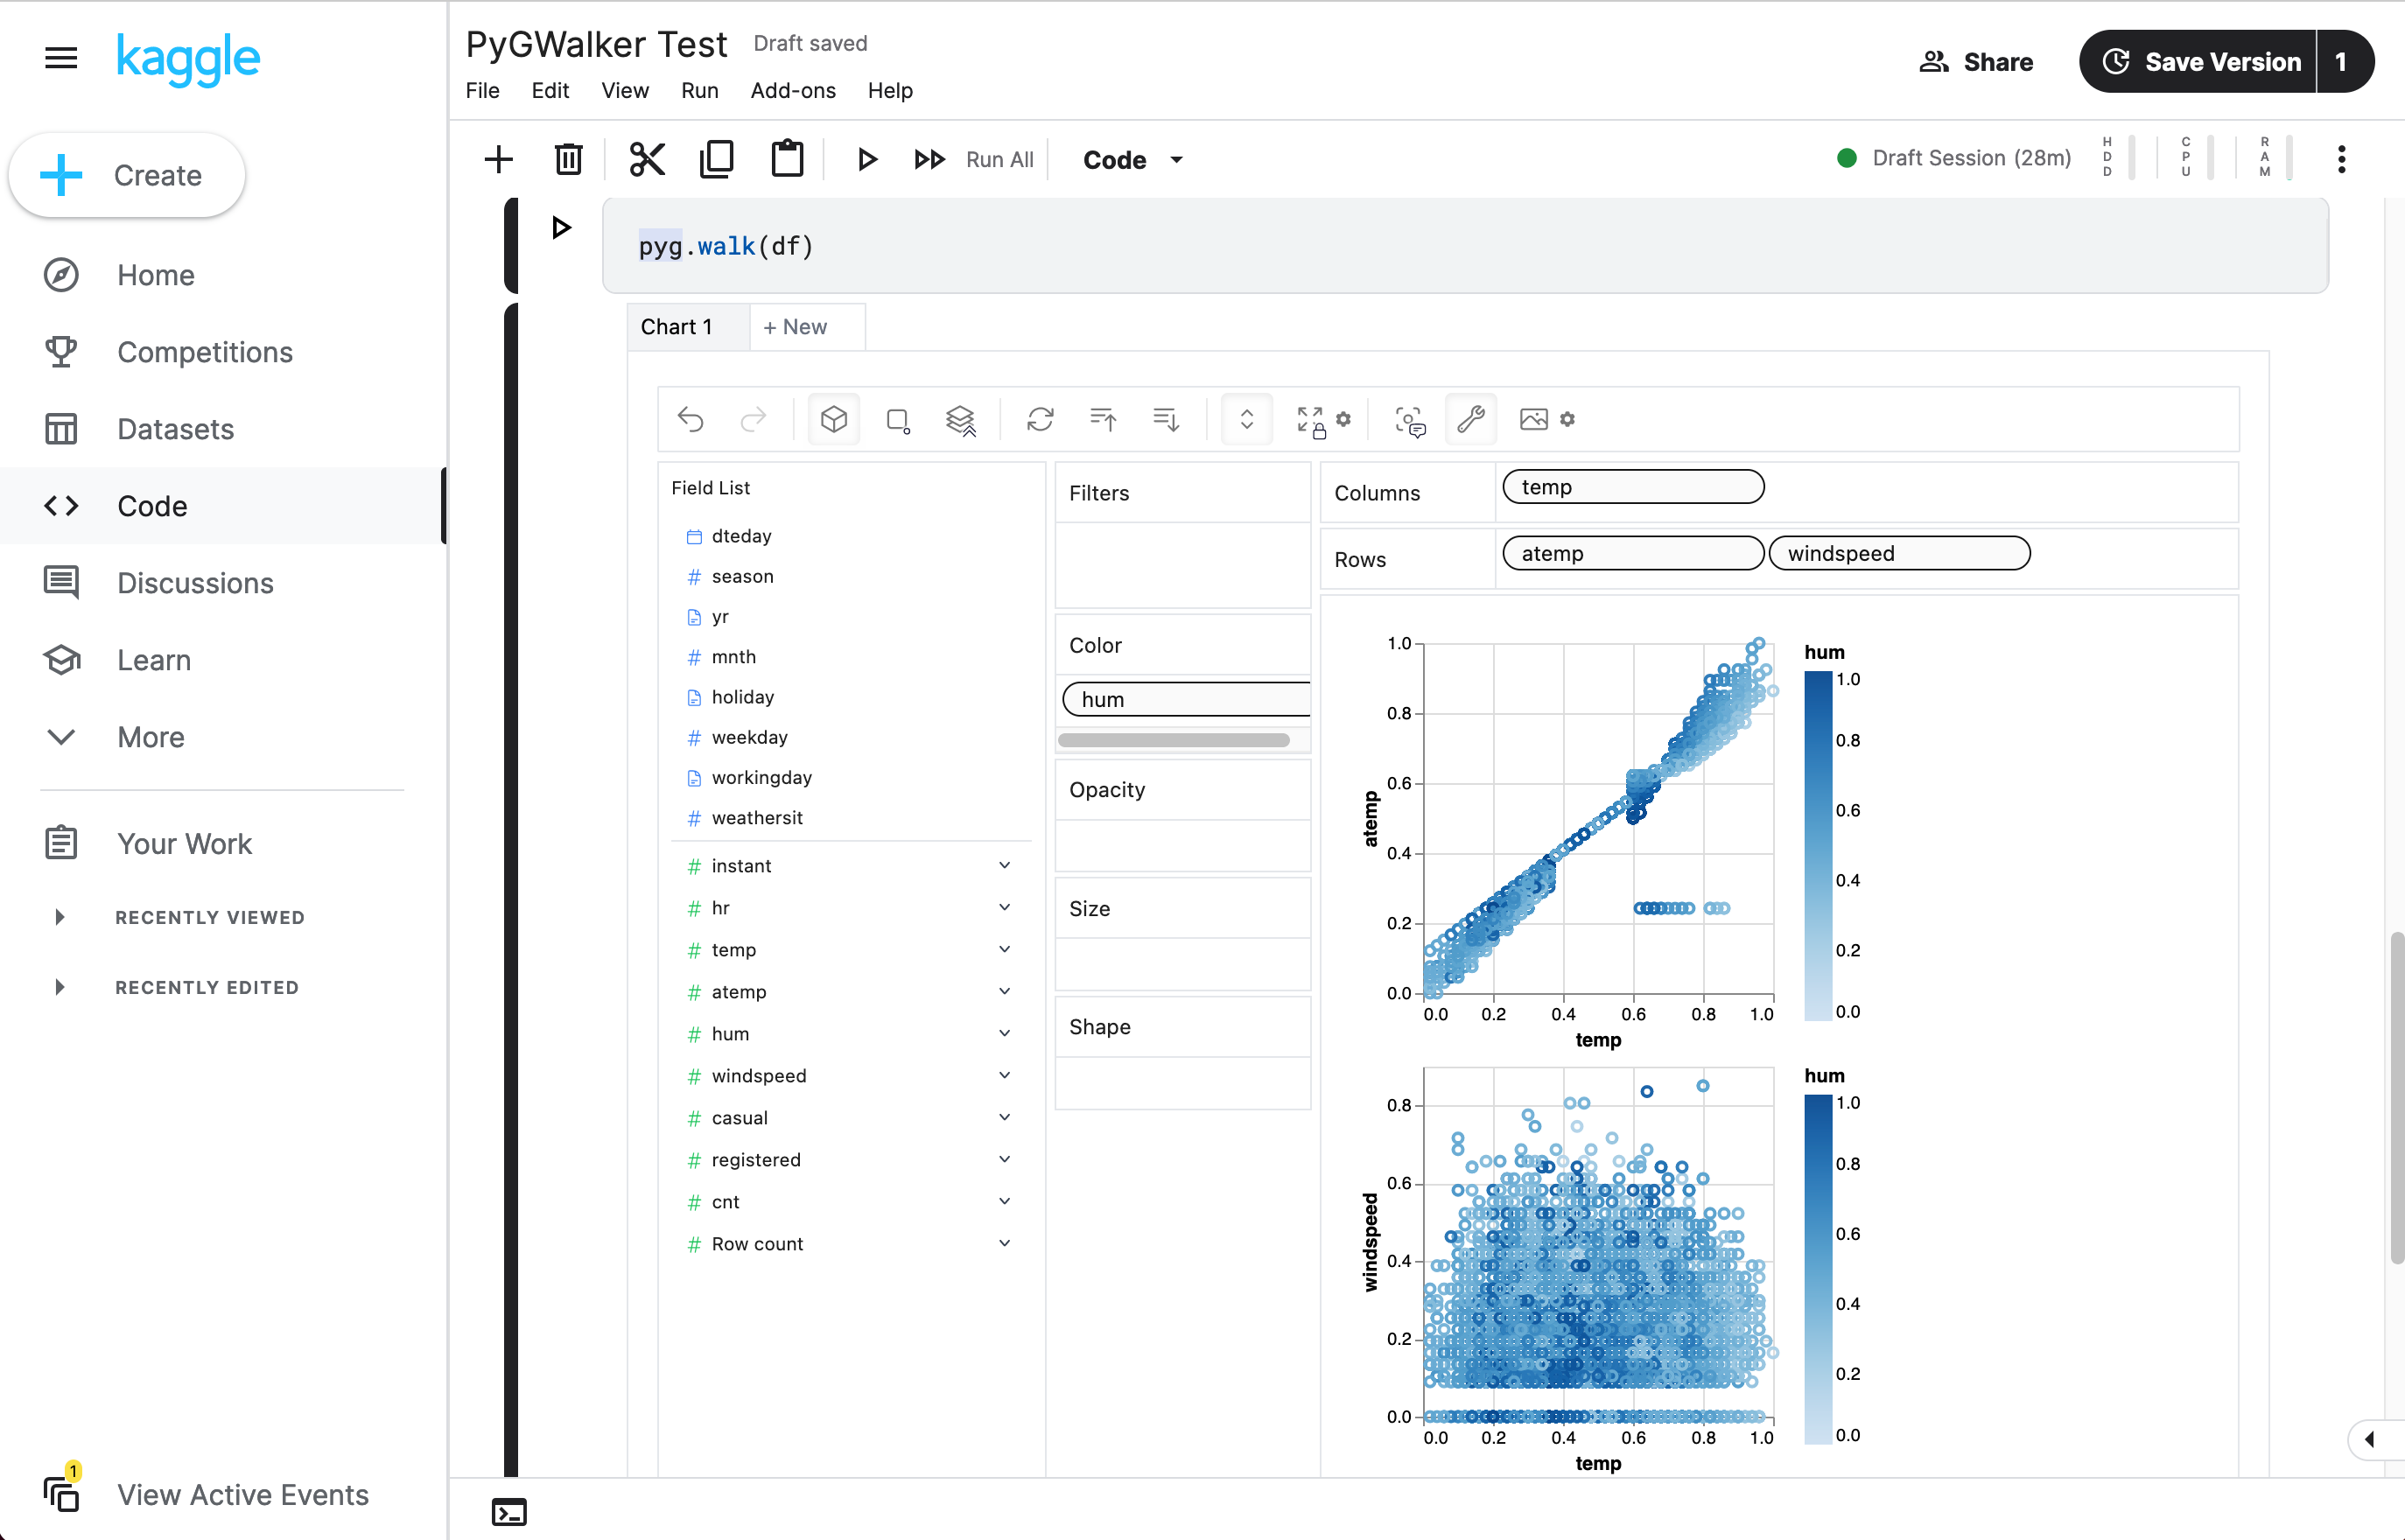 |
| 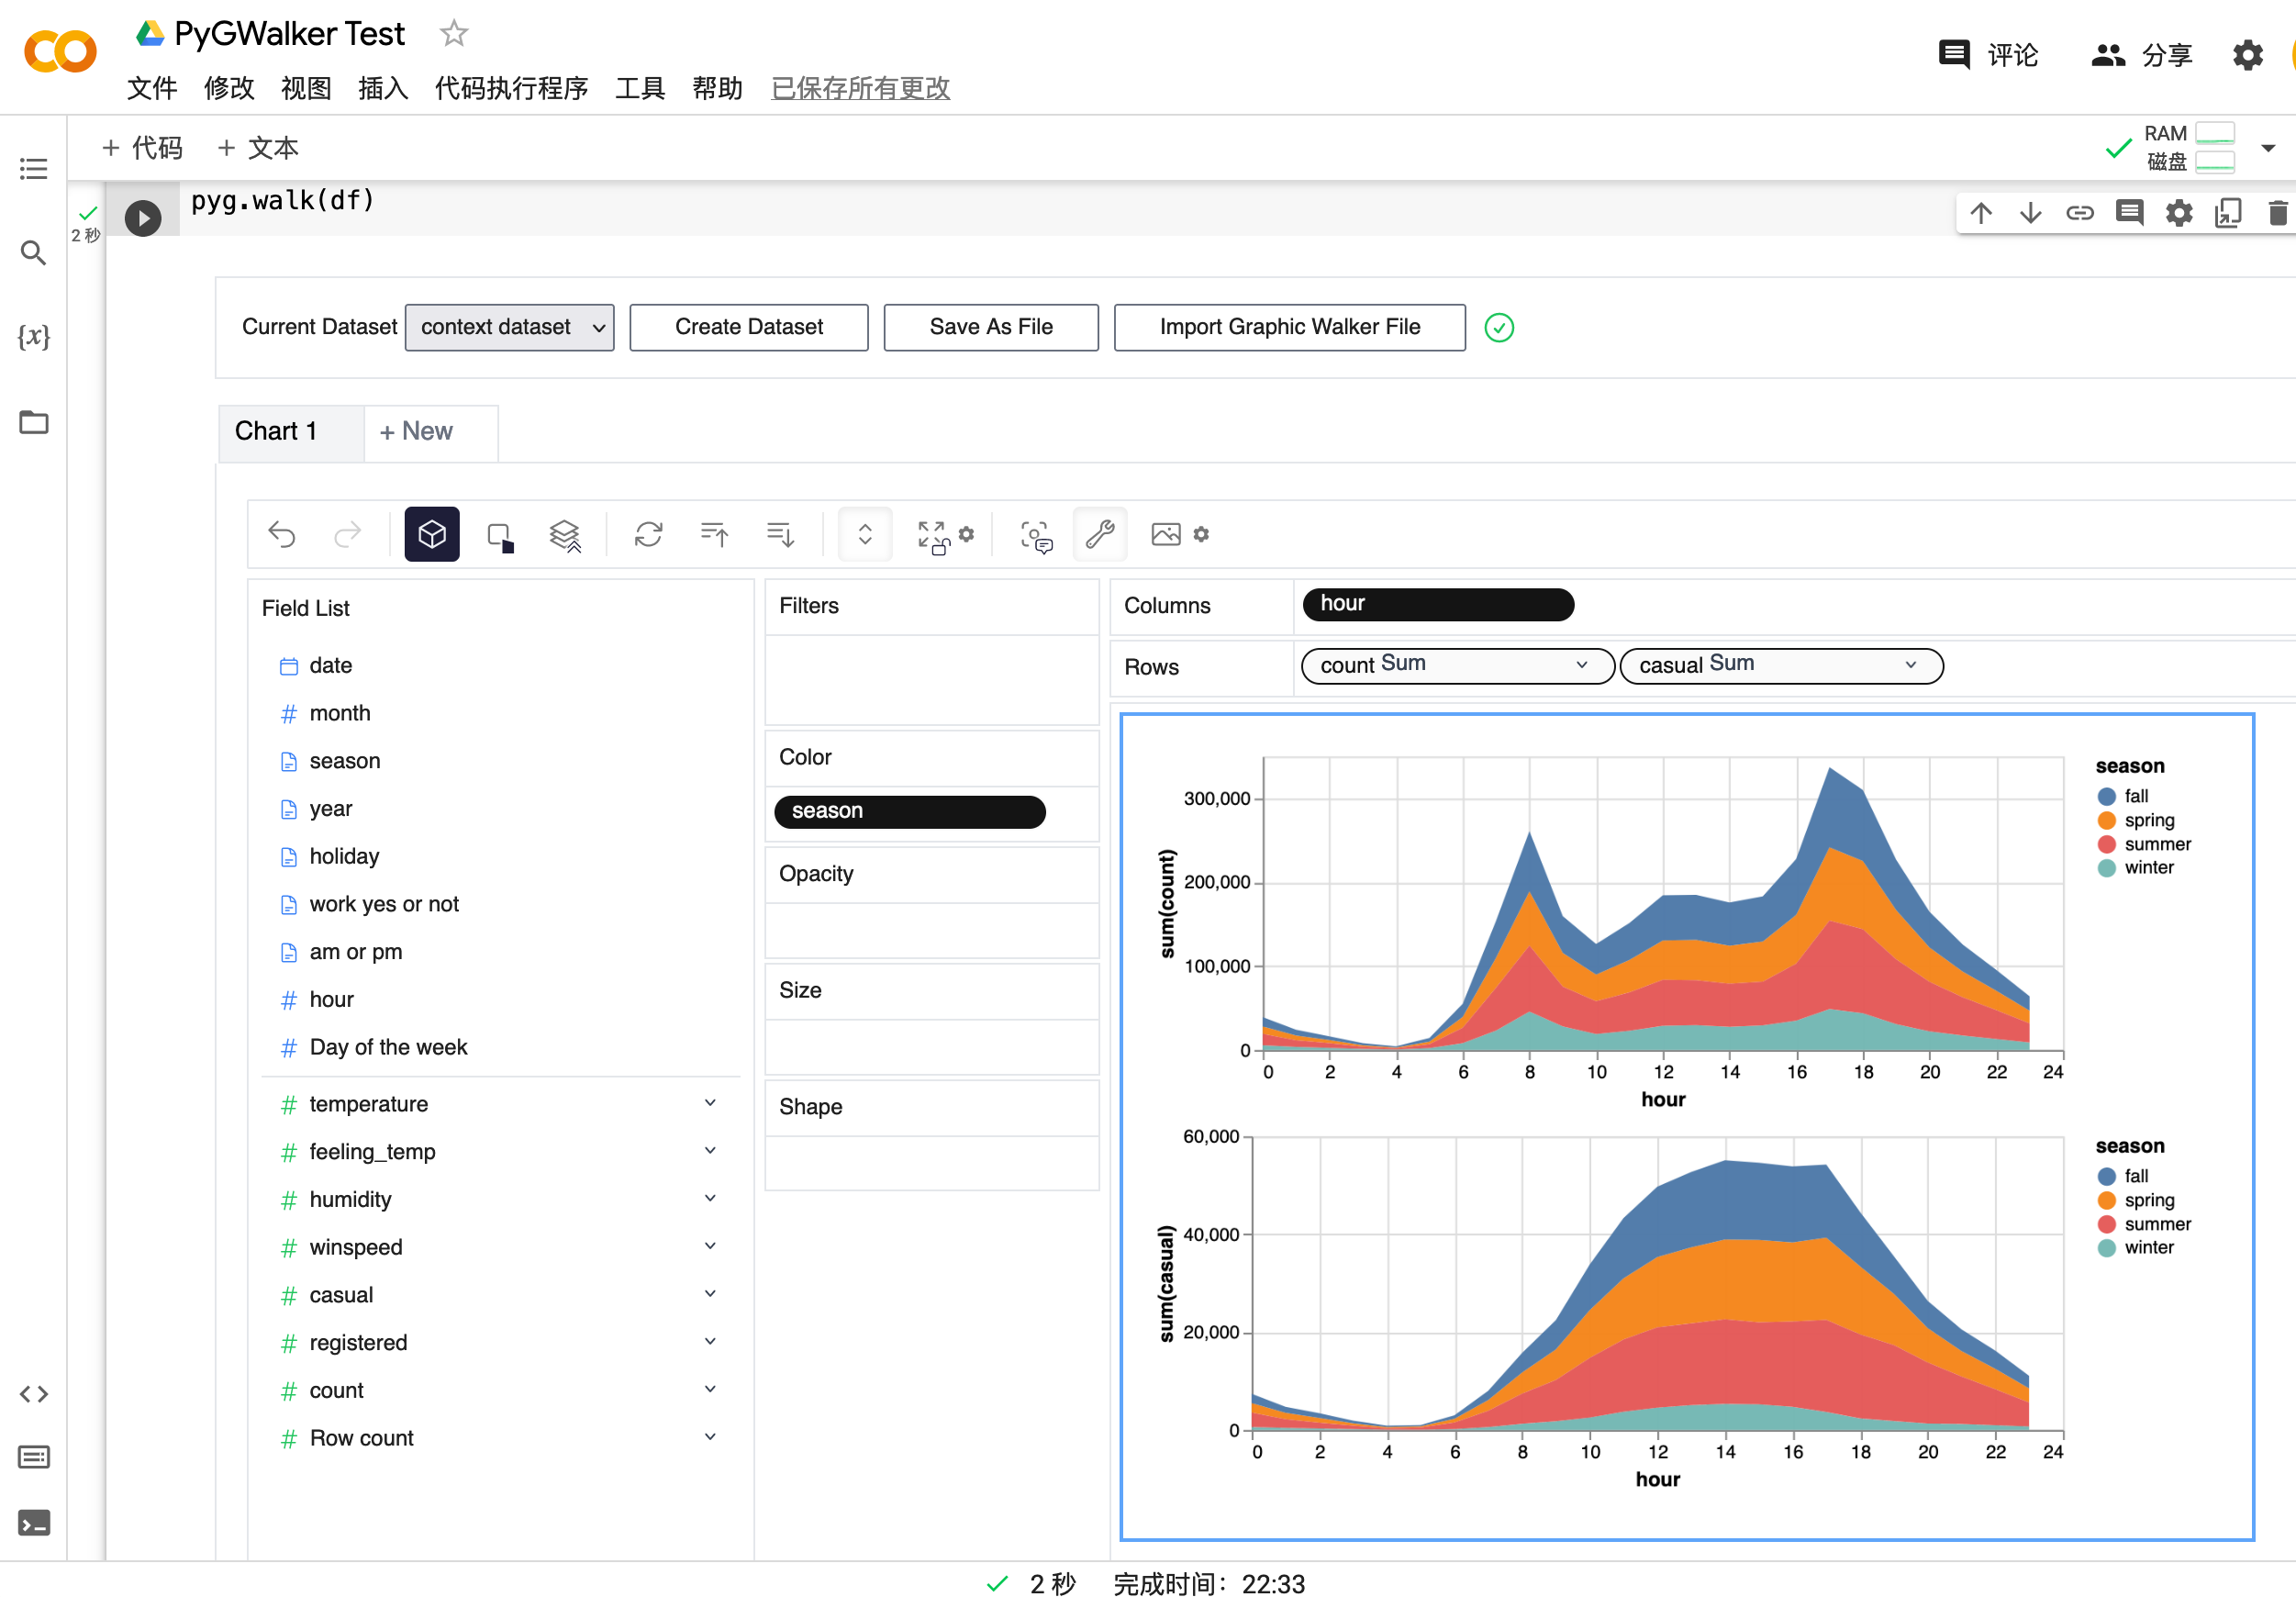 |
|
Setup pygwalker
Before using pygwalker, make sure to install the packages through the command line using pip or conda.
pip
pip install pygwalker
Note
For an early trial, you can install with
pip install pygwalker --upgradeto keep your version up to date with the latest release or evenpip install pygwalker --upgrade --preto obtain latest features and bug-fixes.
Conda-forge
conda install -c conda-forge pygwalker
or
mamba install -c conda-forge pygwalker
See conda-forge feedstock for more help.
Use pygwalker in Jupyter Notebook
Quick Start
Import pygwalker and pandas to your Jupyter Notebook to get started.
import pandas as pd
import pygwalker as pyg
You can use pygwalker without breaking your existing workflow. For example, you can call up PyGWalker with the dataframe loaded in this way:
df = pd.read_csv('./bike_sharing_dc.csv')
walker = pyg.walk(df)
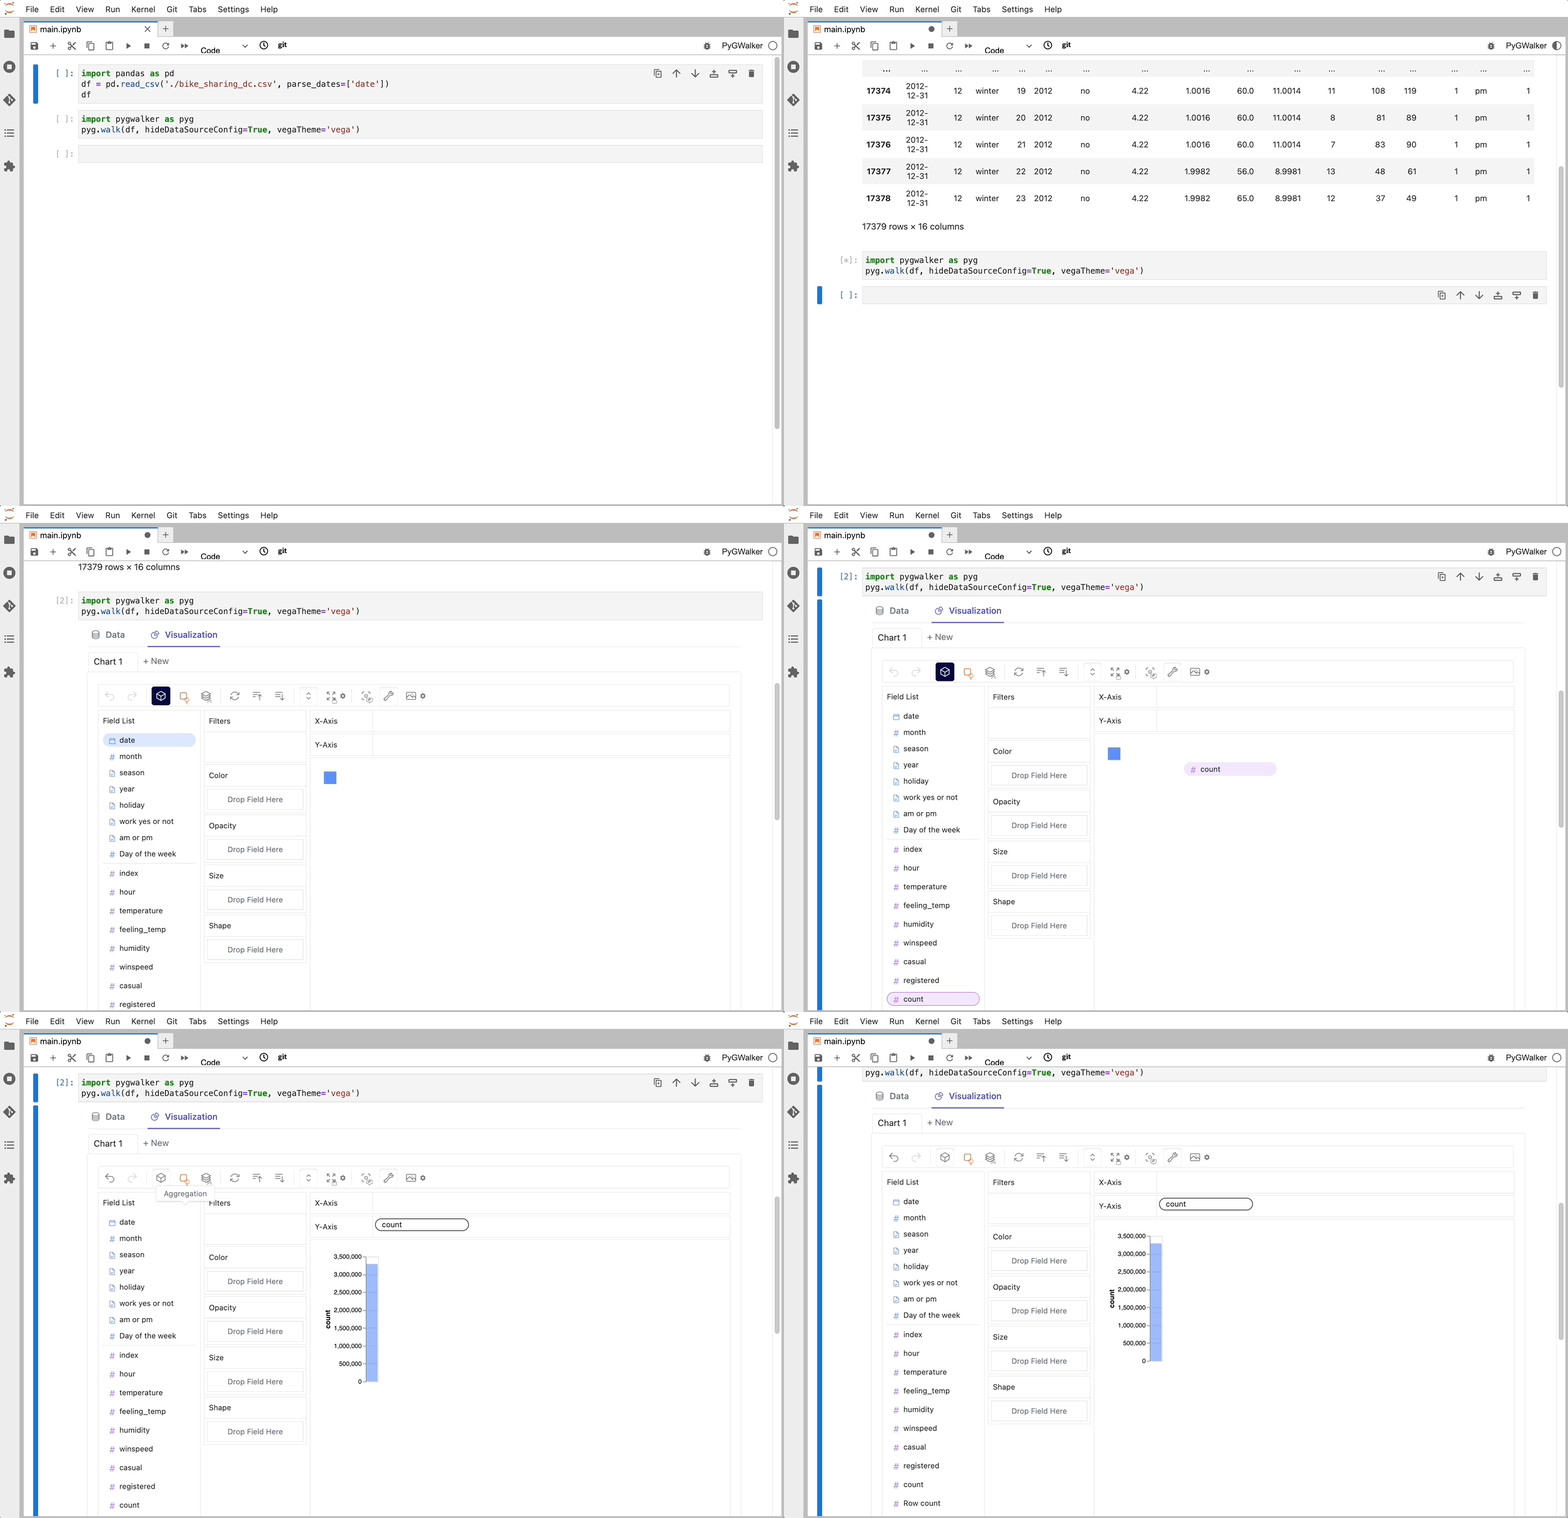
That's it. Now you have an interactive UI to analyze and visualize data with simple drag-and-drop operations.
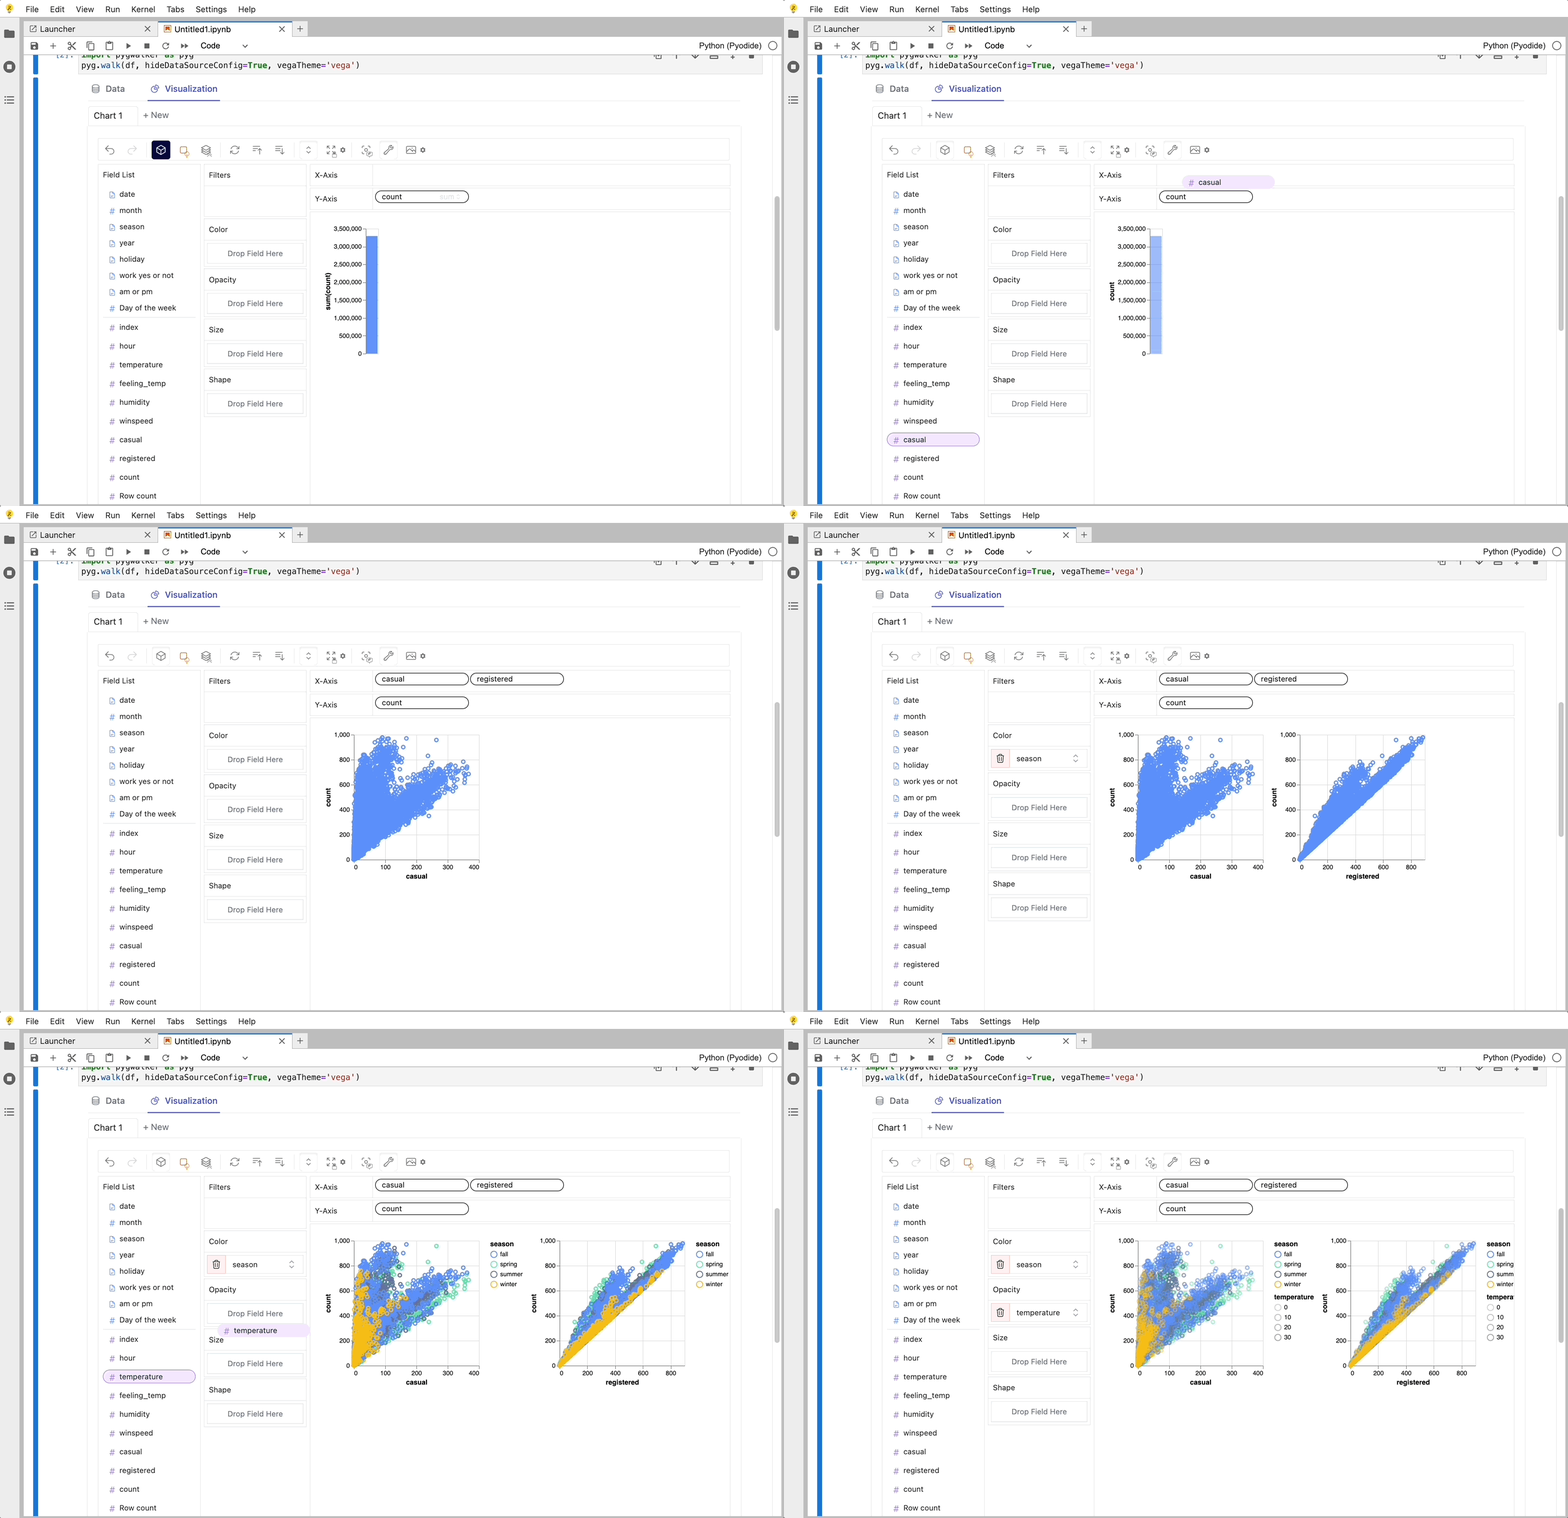
Cool things you can do with PyGwalker:
-
You can change the mark type into others to make different charts, for example, a line chart:

-
To compare different measures, you can create a concat view by adding more than one measure into rows/columns.

-
To make a facet view of several subviews divided by the value in dimension, put dimensions into rows or columns to make a facets view.

-
PyGWalker contains a powerful data table, which provides a quick view of data and its distribution, profiling. You can also add filters or change the data types in the table.
<img width="1537" alt="pygwalker-data-preview" src="https://github.com/Kanaries/pygwalker/assets/22167673/e3239932-bc3c-4de3-8387-1eabf2ca3a3a"> -
You can save the data exploration result to a local file
Better Practices
There are some important parameters you should know when using pygwalker:
spec_path: local file path for saving/loading chart config.spec: chart config object, JSON string, config ID, or remote URL.computation: choose where data queries run. Use"browser"for frontend-only computation,"kernel"for local DuckDB-backed Python computation,"cloud"for Kanaries cloud computation, or omit it for the default automatic behavior.kernel_computation: legacy boolean for using DuckDB as computing engine. Prefercomputation="kernel"orcomputation="browser"; this legacy flag is scheduled for removal in PyGWalker 0.7.0.cloud_computation: legacy boolean for Kanaries cloud computation. Prefercomputation="cloud"; this legacy flag is scheduled for removal in PyGWalker 0.7.0.use_kernel_calc: deprecated alias for kernel computation. Prefercomputation="kernel"orcomputation="browser"; this legacy flag is scheduled for removal in PyGWalker 0.7.0.
df = pd.read_csv('./bike_sharing_dc.csv')
walker = pyg.walk(
    df,
    spec_path="./chart_meta_0.json",  # local file used to load and save chart state.
    computation="kernel",          # use DuckDB in the Python kernel for larger datasets.
)
For new code on the 0.6 line, prefer a reusable Walker object and
Related Skills
codebase-memory-mcp
38.1kHigh-performance code intelligence MCP server. Indexes codebases into a persistent knowledge graph — average repo in milliseconds. 158 languages, sub-ms queries, 99% fewer tokens. Single static binary, zero dependencies.
codebase-memory-mcp
38.1kHigh-performance code intelligence MCP server. Indexes codebases into a persistent knowledge graph — average repo in milliseconds. 158 languages, sub-ms queries, 99% fewer tokens. Single static binary, zero dependencies.
codebase-memory-mcp
38.1kHigh-performance code intelligence MCP server. Indexes codebases into a persistent knowledge graph — average repo in milliseconds. 158 languages, sub-ms queries, 99% fewer tokens. Single static binary, zero dependencies.
tabularis
4.0kOpen-source desktop SQL workspace for PostgreSQL, MySQL/MariaDB, SQLite and 15+ more databases like DuckDB, ClickHouse, Redis and Firestore. Built-in MCP server for Claude, Cursor and Devin, SQL notebooks and visual EXPLAIN.
