AAChartCore
📈📊☕️☕️☕️An elegant modern declarative data visualization chart framework for Android. Extremely powerful, supports line, spline, area, areaspline, column, bar, pie, scatter, angular gauges, arearange, areasplinerange, columnrange, bubble, box plot, error bars, funnel, waterfall and polar chart types.极其精美而又强大的 Android 数据可视化图表框架,支持柱状图、条形图、折线图、曲线图、折线填充图、曲线填充图、气泡图、扇形图、环形图、散点图、雷达图、混合图等各种类型的多达几十种的信息图图表,完全满足工作所需.
Install / Use
/learn @AAChartModel/AAChartCoreREADME
![]()
AAChartCore
![]() </br>
</br>
![]() </br>
</br>
![]() </br>
</br>
![]() </br>
</br>
![]() </br>
</br>
 </br>
</br>
 </br>
</br>
![]()
![]()


English Document 🇬🇧 | 简体中文文档 🇨🇳
There is the link of Kotlin version of AAChartCore as follow
https://github.com/AAChartModel/AAChartCore-Kotlin
Preface
AAChartCore is the Java language version of AAChartKit which is object-oriented, a set of easy-to-use, extremely elegant graphics drawing controls,based on the popular open source front-end chart library Highcharts. It makes it very fast to add interactive charts to your mobile projects. It supports single touch-drag for data inspection, multi-touch for zooming, and advanced responsiveness for your apps .
Features
-
🎂 Environment friendly. Support all Android platforms. Totally support
Javalanguage, and there are more types version such asKotlinlanguage version AAInfographics、Swiftlanguage version AAChartKit-Swift 、Objective-clanguage version AAChartKit . To get more details you can see the source code links list. -
🚀 Powerful and easy to use. It supports
column chart,bar chart,area chart,areaspline chart,line chart,spline chart,radar chart,polar chart,pie chart,bubble chart,pyramid chart,funnel chart,columnrange chart,arearange chart,mixed chartand other graphics. Support for more chart types is planned. -
📝 Modern Declarative Syntax. Unlike previous imperative programming techniques, drawing any custom chart in AAChartKit, you don't need to care about the inner implementation details which is annoying && boring. Describe what you want, you will get what you described.
-
🎮 Interactive and animated. The charts
animationeffect is exquisite, delicate, smooth and beautiful. -
⛓ Chain programming. Supports concise
chain programming syntax. -
🦋 Minimalist.
AAChartView + AAChartModel = Chart. The AAChartKit follows a minimalist formula: Chart view + Chart model = The chart you want, just like the powerful and beautiful charts lib AAInfographics. -
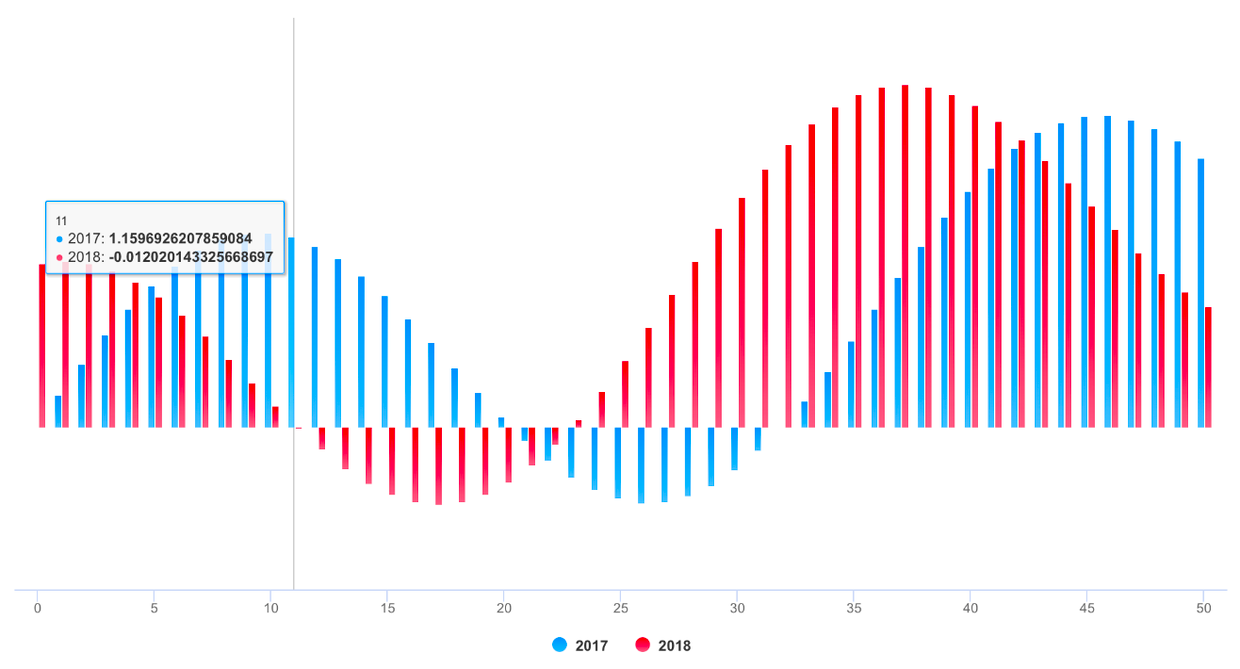
🖱 Interaction event callback. Support for monitoring user click events and single finger move over events, which can be used to achieve double charts linked-working and even multiple charts linkage, as well as other more complex custom user interaction effects.
Appreciation
<div> <img src='https://github.com/AAChartModel/loadHtmlCssJsDemo-master/blob/master/AAChartKit/BeautyAppreciation/ColumnChart.png' width="24%" > <img src='https://github.com/AAChartModel/loadHtmlCssJsDemo-master/blob/master/AAChartKit/BeautyAppreciation/BarChart.png' width="24%" > <img src='https://github.com/AAChartModel/loadHtmlCssJsDemo-master/blob/master/AAChartKit/BeautyAppreciation/AreaChart.png' width="24%" > <img src='https://github.com/AAChartModel/loadHtmlCssJsDemo-master/blob/master/AAChartKit/BeautyAppreciation/LineChart.png' width="24%" > </div> <div> <img src='https://github.com/AAChartModel/loadHtmlCssJsDemo-master/blob/master/AAChartKit/BeautyAppreciation/StepAreaChart.png' width="24%" > <img src='https://github.com/AAChartModel/loadHtmlCssJsDemo-master/blob/master/AAChartKit/BeautyAppreciation/StepLineChart.png' width="24%" > <img src='https://raw.githubusercontent.com/AAChartModel/Gallery/master/AAChartKit/splineChart.png' width="24%" > <img src='https://raw.githubusercontent.com/AAChartModel/Gallery/master/AAChartKit/areasplineChart.png' width="24%" > </div> <div> <img src='https://raw.githubusercontent.com/AAChartModel/Gallery/master/AAChartKit/percentStackingAreasplineChart.png' width="24%" > <img src='https://github.com/AAChartModel/Gallery/blob/master/AAInfographics/BubbleChart.png' width="24%"> <img src='https://github.com/AAChartModel/Gallery/blob/master/AAInfographics/ArearangeAverageValueChart.png' width="24%"> <img src='https://github.com/AAChartModel/Gallery/blob/master/AAInfographics/ColumnMixedLineChart.png' width="24%"> </div> <div> <img src='https://raw.githubusercontent.com/AAChartModel/Gallery/master/AAChartKit/scatterChart.png' width="24%" > <img src='https://raw.githubusercontent.com/AAChartModel/Gallery/master/AAChartKit/boxplotChart.png' width="24%"> <img src='https://raw.githubusercontent.com/AAChartModel/Gallery/master/AAChartKit/MirrorColumnChart.png' width="24%"> <img src='https://raw.githubusercontent.com/AAChartModel/Gallery/master/AAChartKit/stackingColumnChart.png' width="24%"> </div>Installation
JitPack (Recommend)
allprojects {
    repositories {
        ...
        maven { url 'https://jitpack.io' }
    }
}
dependencies {
    ...
    implementation 'com.github.AAChartModel:AAChartCore:-SNAPSHOT'
}
Usage
- Creat the instance object of chart view:
AAChartView
<com.github.AAChartModel.AAChartCore.AAChartCreator.AAChartView
    android:id="@+id/AAChartView"
    android:layout_width="match_parent"
    android:layout_height="match_parent" />
aaChartView = findViewById(R.id.AAChartView)
- Configure the properties of chart model:
AAChartModel
AAChartModel aaChartModel = new AAChartModel()
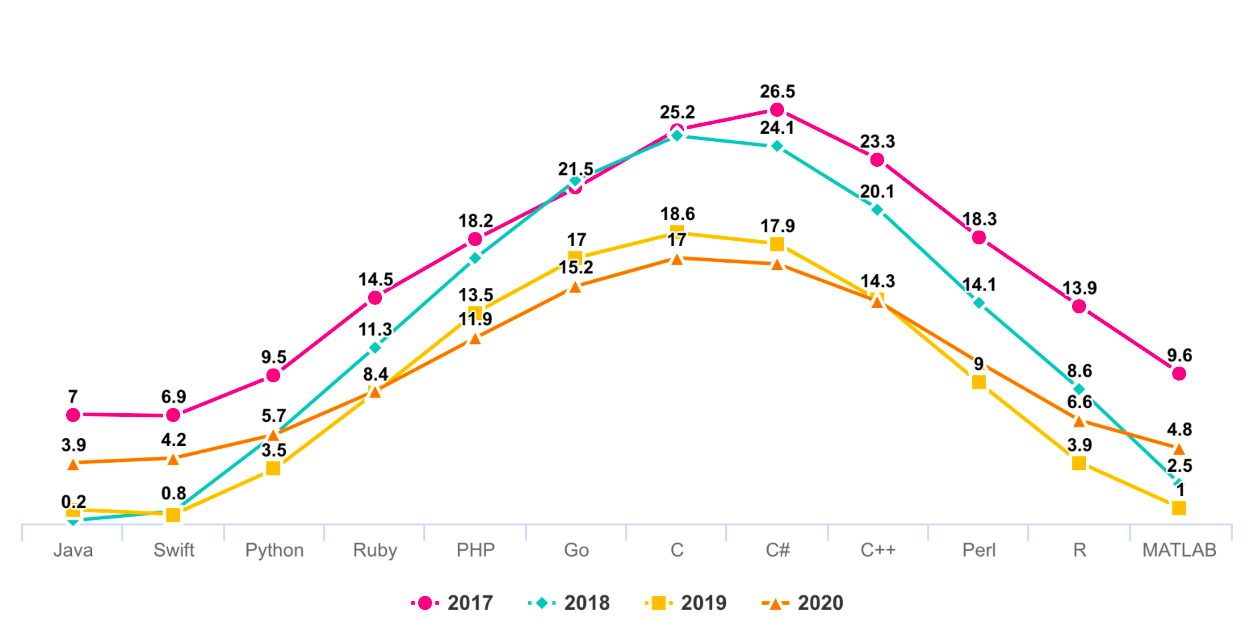
.chartType(AAChartType.Area)
.title("THE HEAT OF PROGRAMMING LANGUAGE")
.subtitle("Virtual Data")
.backgroundColor("#4b2b7f")
.categories(new String[]{"Java", "Swift", "Python", "Ruby", "PHP", "Go", "C", "C#", "C++"})
.dataLabelsEnabled(false)
.yAxisGridLineWidth(0f)
.series(new AASeriesElement[]{
new AASeriesElement()
.name("Tokyo")
.data(new Object[]{7.0, 6.9, 9.5, 14.5, 18.2, 21.5, 25.2, 26.5, 23.3, 18.3, 13.9, 9.6}),
new AASeriesElement()
.name("NewYork")
.data(new Object[]{0.2, 0.8, 5.7, 11.3, 17.0, 22.0, 24.8, 24.1, 20.1, 14.1, 8.6, 2.5}),
new AASeriesElement()
.name("London")
.data(new Object[]{0.9, 0.6, 3.5, 8.4, 13.5, 17.0, 18.6, 17.9, 14.3, 9.0, 3.9, 1.0}),
new AASeriesElement()
.name("Berlin")
.data(new Object[]{3.9, 4.2, 5.7, 8.5, 11.9, 15.2, 17.0, 16.6, 14.2, 10.3, 6.6, 4.8})
});
- Draw the chart(This method is called only for the first time after you create an AAChartView instance object)
        //The chart view object calls the instance object of AAChartModel and draws the final graphic
        aaChartView.aa_drawChartWithChartModel(aaChartModel)
🌹🌹🌹Congratulations! Everything was done!!! You will get what you want!!!
Update chart content
if you want to refresh chart content,you should do something as follow.According to your actual needs, select the function that fits you.
- Only refresh the chart data(This method is recommended to be called for updating the series data dynamically)
        //Only refresh the chart series data
        aaChartView.aa_onlyRefreshTheChartDataWithChartModelSeries(chartModelSeriesArray)
- Refresh the chart, minus the chart data (this method is recommended for subsequent refreshes after the first drawing of graphics has completed. If you want to update the chart data only, you should use the function
aa_onlyRefreshTheChartDataWithChartModelSeries)
        //Refresh the chart after the AAChartModel whole content is updated
        aaChartView.aa_refreshChartWholeContentWithChartModel(aaChartModel)
Infographics sample
-
line chart
-
column chart
-
bar chart
